4 Water: A Necessity for Life
Introduction:
Why do scientists spend time looking for water on other planets? Why is water so important? It is because water is essential for life as we know it. Water is one of the more abundant molecules and the one most critical to life on Earth. Approximately 60–70 percent of the human body is made up of water. Without it, life as we know it simply would not exist. The quote from Mark Twain, “Whiskey is for drinking. Water is for fighting” suggests that water was and still is extremely important. In recent years, we have seen a rise in conflicts and dispute about water. Fortunately, most of the conflicts have ended up in the courts instead of the battlefields. Water, air, and food are the most important natural resources to people. Humans can live only a few minutes without oxygen, about a week without water, and about a month without food. Water also is essential for our oxygen and food supply. Plants, which require water to survive, provide oxygen through photosynthesis and form the base of our food supply. Plants grow in soil, which forms by weathering reactions between water and rock.
Water is an important commodity for life on Earth and is something we all need in our daily activities. It is referred to by many people as the “essence of life”, “blue gold” and “more precious than oil”. What makes water so important is its unique and special properties. These special properties of water include water’s high heat capacity and heat of vaporization, its ability to dissolve numerous polar molecules, its cohesive and adhesive properties, and its dissociation into ions that leads to the generation of pH. The abundance of water on Earth distinguishes us from other bodies in the solar system. About 70% of Earth’s surface is covered by oceans and approximately half of Earth’s surface is obscured by clouds at any time. There is a very large volume of water on our planet, about 1.4 billion cubic kilometers (km3) (330 million cubic miles) or about 53 billion gallons per person on Earth. All of Earth’s water could cover the United States to a depth of 145 km (90 mi). From a human perspective, the problem is that over 97% of it is seawater, which is too salty to drink or use for irrigation.
The most commonly used water sources are rivers and lakes, which contain less than 0.01% of the world’s water! Understanding these characteristics helps us understand and appreciate its importance in maintaining life on Earth.
One of our most important environmental goals is to provide a clean, sufficient, and sustainable water supply for the world. Fortunately, water is a renewable resource, and it is difficult to destroy. Evaporation and precipitation combine to replenish our fresh water supply constantly and quickly; however, water availability is complicated by its uneven distribution over the Earth. Arid climate and densely populated areas have combined in many parts of the world to create water shortages, which are projected to worsen significantly in the coming years. Human activities such as water overuse and water pollution have compounded the water crisis that exists today. Hundreds of millions of people lack access to safe drinking water, and billions of people lack access to improved sanitation as simple as a pit latrine. As a result, nearly two million people die every year from diarrheal diseases and 90% of those deaths occur among children under the age of 5. Most of these are easily prevented deaths.
Water is the only substance that occurs naturally on Earth in three forms: solid, liquid and gas. It is distributed in various locations, called water reservoirs. The oceans are by far the largest of the reservoirs with about 97% of all water but that water is too saline for most human uses (see Figure Earth’s Water Reservoirs). Ice caps and glaciers are the largest reservoirs of fresh water but this water is inconveniently located, mostly in Antarctica and Greenland. Shallow groundwater is the largest reservoir of usable fresh water. Although rivers and lakes are the most heavily used water resources, they represent only a tiny amount of the world’s water. If all of world’s water was shrunk to the size of 1 gallon, then the total amount of fresh water would be about 1/3 cup, and the amount of readily usable fresh water would be 2 tablespoons.
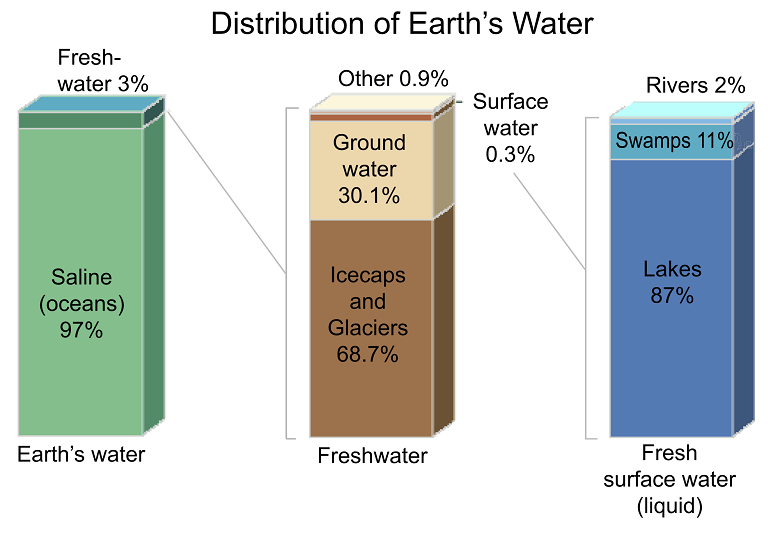
Earth’s Water Reservoirs Bar chart Distribution of Earth’s water including total global water, fresh water, and surface water and other
fresh water
The water cycle shows the movement of water through different reservoirs, which include oceans, atmosphere, glaciers, groundwater, lakes, rivers, and biosphere. Solar energy and gravity drive the motion of water in the water cycle. Simply put, the water cycle involves water moving from the ocean to the atmosphere by evaporation, forming clouds. From clouds, it falls as precipitation (rain and snow) on both water
and land, where it can move in a variety of ways. The water on land can either return to the ocean by surface runoff (unchannelized overland flow), rivers, glaciers, and subsurface groundwater flow, or return to the atmosphere by evaporation or transpiration (loss of water by plants to the atmosphere).
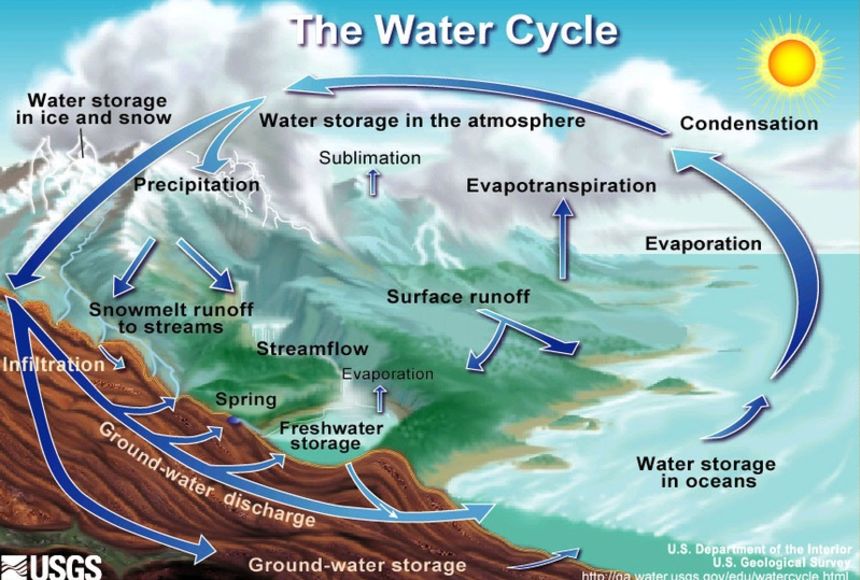
The Water Cycle Arrows depict movement of water to different
reservoirs located above, at, and below Earth’s surface.
An important part of the water cycle is how water varies in salinity, which is the abundance of dissolved ions in water. Ocean water is called salt water because it is highly saline, with about 35,000 mg of dissolved ions per liter of seawater. Evaporation (where water changes from liquid to gas at ambient temperatures) is a distillation process that produces nearly pure water with almost no dissolved ions. As water vaporizes, it leaves the dissolved ions in the original liquid phase. Eventually, condensation (where water changes from gas to liquid) forms clouds and sometimes precipitation (rain and snow). After rainwater falls onto land, it dissolves minerals, which increases its salinity. Most lakes, rivers, and near-surface groundwater have a relatively low salinity and are called fresh water.
One estimate of global water distribution
(Percents are rounded, so will not add to 100)
| Water source | Water volume, in cubic miles | Water volume, in cubic kilometers | Percent of freshwater |
Percent of total water |
|---|---|---|---|---|
| Oceans, Seas, & Bays | 321,000,000 | 1,338,000,000 | — | 96.54 |
| Ice caps, Glaciers, & Permanent Snow | 5,773,000 | 24,064,000 | 68.7 | 1.74 |
| Groundwater | 5,614,000 | 23,400,000 | — | 1.69 |
| Fresh | 2,526,000 | 10,530,000 | 30.1 | 0.76 |
| Saline | 3,088,000 | 12,870,000 | — | 0.93 |
| Soil Moisture | 3,959 | 16,500 | 0.05 | 0.001 |
| Ground Ice & Permafrost | 71,970 | 300,000 | 0.86 | 0.022 |
| Lakes | 42,320 | 176,400 | — | 0.013 |
| Fresh | 21,830 | 91,000 | 0.26 | 0.007 |
| Saline | 20,490 | 85,400 | — | 0.006 |
| Atmosphere | 3,095 | 12,900 | 0.04 | 0.001 |
| Swamp Water | 2,752 | 11,470 | 0.03 | 0.0008 |
| Rivers | 509 | 2,120 | 0.006 | 0.0002 |
| Biological Water | 269 | 1,120 | 0.003 | 0.0001 |
Source: Igor Shiklomanov’s chapter “World fresh water resources” in Peter H. Gleick (editor), 1993, Water in Crisis: A Guide to the World’s Fresh Water Resources (Oxford University Press, New York).
Primary Fresh Water Resources: Precipitation
Precipitation is a major control of fresh water availability, and it is unevenly distributed around the globe (see Figure World Rainfall Map). More precipitation falls near the equator, and landmasses there are characterized by a tropical rainforest climate. Less precipitation tends to fall near 20–30° north and south latitude, where the world’s largest deserts are located. These rainfall and climate patterns are related to global wind circulation cells. The intense sunlight at the equator heats air, causing it to rise and cool, which decreases the ability of the air mass to hold water vapor and results in frequent rainstorms. Around 30° north and south latitude, descending air conditions produce warmer air, which increases its ability to hold water vapor and results in dry conditions. Both the dry air conditions and the warm temperatures of these latitude belts favor evaporation. Global precipitation and climate patterns are also affected by the size of continents,
major ocean currents, and mountains.
Total Rainfall:
![The global map of (a) generalized average annual precipitation and (b) overall water scarcity risks. Reproduced from Water Science School, Generalized world precipitation map; published by U.S. Geological Survey. Reproduced with permission from Gassert, Francis, et al., Aqueduct Global Maps 2.1: Constructing Decision-Relevant Global Water Risk Indicators; published by World Resources Institute, 2014 [3,52].](https://www.researchgate.net/publication/360769198/figure/fig7/AS:1160715008245771@1653747431742/The-global-map-of-a-generalized-average-annual-precipitation-and-b-overall-water.png)
World Rainfall Map The false-color map above shows the amount of rain that falls around the world. Areas of high rainfall include Central
and South America, western Africa, and Southeast Asia. Since these areas receive so much rainfall, they are where most of the world’s
rainforests grow. Areas with very little rainfall usually turn into deserts. The desert areas include North Africa, the Middle East,
western North America, and Central Asia.
https://earthobservatory.nasa.gov/global-maps/GPM_3IMERGM
Surface Water Resources: Rivers, Lakes, Glaciers
Flowing water from rain and melted snow on land enters river channels by surface runoff and groundwater seepage. River discharge describes the volume of water moving through a river channel over time. The relative contributions of surface runoff vs. groundwater
seepage to river discharge depend on precipitation patterns, vegetation, topography, land use, and soil characteristics. Soon after a heavy rainstorm, river discharge increases due to surface runoff. The steady normal flow of river water is mainly from groundwater that discharges into the river. Gravity pulls river water downhill toward the ocean. Along the way the moving water of a river can erode soil particles and dissolve minerals, creating the river’s load of moving sediment grains and dissolved ions. Groundwater also contributes a large amount of the dissolved ions in river water. The geographic area drained by a river and its tributaries is called a drainage basin. The Mississippi River drainage basin includes approximately 40% of the U.S., a measure that includes the smaller drainage basins (also called watersheds), such as the Ohio River and Missouri River that help to comprise it. Rivers are an important water resource for irrigation and many cities around the world. Some of the world’s rivers that have had international disputes over water supply include the Colorado (Mexico, southwest U.S.), Nile (Egypt, Ethiopia, Sudan), Euphrates (Iraq, Syria, Turkey), Ganges (Bangladesh, India), and Jordan (Israel, Jordan, Syria).

Surface Runoff Surface runoff, part of overland flow in the water cycle Source:
James M. Pease at Wikimedia Commons
This diagram is a very general schematic of how groundwater contributes water into surface water (streams, rivers, and lakes). In this case, this is a “gaining stream”, which generally gains water from the ground.
A gaining stream has water seeping into it from the ground.

water resource. Source Colorado River Basin map. https://www.usgs.gov/media/images/colorado-river-basin-map
eruptions (Crater Lake, Oregon). People also create artificial lakes (reservoirs) by damming rivers. Large changes in climate can result in
major changes in a lake’s size. As Earth was coming out of the last Ice Age about fifteen thousand years ago, the climate in the western U.S. changed from cool and moist to warm and arid, which caused more than100 large lakes to disappear. The Great Salt Lake in Utah is a remnant of a much larger lake called Lake Bonneville.
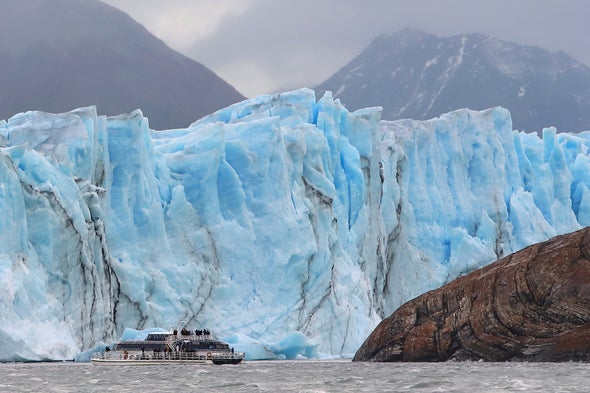
from most people (see Figure Mountain Glacier in Argentina). Melting glaciers do provide a natural source of river water and groundwater. During the last Ice Age there was as much as 50% more water in glaciers than there is today, which caused sea level to be about 100 m lower. Over the past century, sea level has been rising in part due to melting glaciers. If Earth’s climate continues to warm, the melting glaciers will cause an additional rise in sea level.
more than 30 times more water than rivers and lakes combined. Groundwater is a particularly important resource in arid climates, where
surface water may be scarce. In addition, groundwater is the primary water source for rural homeowners, providing 98% of that water demand in the U.S.. Groundwater is water located in small spaces, called pore space, between mineral grains and fractures in subsurface earth materials (rock or rivers or lakes except where there are caves, which are relatively rare. Between the land surface and the depth where there is groundwater is the unsaturated zone, where pore spaces contain only air and water films on mineral grains (see Figure Subsurface Water Terminology). Below the unsaturated zone is the saturated zone, where groundwater completely fills pore spaces in earth materials. The interface between the unsaturated zone and saturated zone is the water table. Most groundwater originates from rain or snowmelt, which infiltrates the ground and moves downward until it reaches the saturated zone. Other sources of groundwater
include seepage from surface water (lakes, rivers, reservoirs, and swamps), surface water deliberately pumped into the ground, irrigation, and
underground wastewater treatment systems, i.e., septic tanks. Recharge areas are locations where surface water infiltrates the ground rather than running off into rivers or evaporating. Wetlands and flat vegetated areas in general are excellent recharge areas. Groundwater is the name for water in the saturated zone and soil moisture describes water in the unsaturated zone. Therefore, groundwater is the underground water resource used by society but soil moisture is the principal water supply for most plants and is an important factor in agricultural productivity.
water table, which follows land surface but in a more subdued way. Source: United States Geological Survey

confining beds. Deep groundwater moves very slowly especially through low permeability layers.


Artesian wells can be sometimes flow to the land surface naturally because of underground pressure.


Credit: Tara Gross, USGS https://www.usgs.gov/special-topics/water-science-school/science/aquifers-and-groundwater
Groundwater and surface water (rivers, lakes, swamps, and reservoirs) are strongly interrelated because both are part of the same overall resource. Major groundwater removal (from pumping or drought) can lower the levels of surface water and vice versa. We can define two types of streams: gaining (effluent) streams and losing (influent) streams.Streams either gain water from inflow of ground water (gaining stream; Figure 12A) or lose water by outflow to ground water (losing stream; Figure 12B). Many streams do both, gaining in some reaches and losing in other reaches. Furthermore, the flow directions between ground water and surface water can change seasonally as the altitude of the ground-water table changes with respect to the stream-surface altitude or can change over shorter timeframes when rises in stream surfaces during storms cause recharge to the streambank. Under natural conditions, ground water makes some contribution to streamflow in most physiographic and climatic settings. Thus, even in settings where streams are primarily losing water to ground water, certain reaches may receive ground-water inflow during some seasons.
Losing streams can be connected to the ground-water system by a continuous saturated zone (Figure 12B) or can be disconnected from the ground-water system by an unsaturated zone (Figure 12C). An important feature of streams that are disconnected from ground water is that pumping of ground water near the stream does not affect the flow of the stream near the pumped well.
Figure 12. Interaction of streams and ground water. (Modified from Winter and others, 1998.)
Gaining streams (A) receive water from the ground-water system, whereas losing streams (B) lose water to the ground-water system. For ground water to discharge to a stream channel, the altitude of the water table in the vicinity of the stream must be higher than the altitude of the stream-water surface. Conversely, for surface water to seep to ground water, the altitude of the water table in the vicinity of the stream must be lower than the altitude of the stream surface. Some losing streams (C) are separated from the saturated ground-water system by an unsaturated zone. Source: https://pubs.usgs.gov/circ/circ1186/html/gw_effect.html

Comal Springs
The highly productive Edwards aquifer, the first aquifer to be designated as a sole source aquifer under the Safe Drinking Water Act, is the source of water for more than 1 million people in San Antonio, Texas, some military bases and small towns, and for south-central Texas farmers and ranchers. The aquifer also supplies water to sustain threatened and endangered species habitat associated with natural springs in the region and supplies surface water to users downstream from the major springs. These various uses are in direct competition with ground-water development and have created challenging issues of ground-water management in the region. (Photograph by Robert Morris, U.S. Geological Survey (https://pubs.usgs.gov/circ/circ1186/html/gw_effect.html ).
Water Use in the U.S
People need water to produce the food, energy, and mineral resources they use—commonly large amounts of it. Consider, for example, these
approximate water requirements for some things people in the developed world use every day: one tomato = 3 gallons; one kilowatt-hour of electricity (from a thermoelectric power plant) = 21 gallons; one loaf of bread = 150 gallons; one pound of beef = 1,600 gallons; and one ton of steel = 63,000 gallons. Human beings require only about 1 gallon per day to survive, but a typical person in a U.S. household uses approximately 100 gallons per day, which includes cooking, washing dishes and clothes, flushing the toilet, and bathing.
The water demand of an area is a function of the population and other uses of water. There are several general categories of water use, including offstream use, which removes water from its source, e.g., irrigation, thermoelectric power generation (cooling electricity-producing equipment in fossil fuel, nuclear, and geothermal power plants), industry, and public supply; consumptive use, which is a type of offstream use where water does not return to the surface water or groundwater system immediately after use, e.g., irrigation water that evaporates or goes to plant growth; and instream use, which is water used but not removed from a river, mostly for hydroelectric power generation. The relative size of these three categories are instream use >> offstream use > consumptive use. In 2005, the U.S. used approximately 3,300 billion gallons per day for instream use, 410 billion gallons per day for offstream use, and 100 billion gallons per day for consumptive use. The major offstream uses of that water were thermoelectric (49%), irrigation (31%), public supply (11%), and industry (4%, see Figure Trends in Total Water Withdrawals by Water-use Category, 1950-2005). About 15% of the total water withdrawals in the U.S. in 2005 were saline water, which was used almost entirely for thermoelectric power generation. Almost all of the water used for thermoelectric power generation is returned to the river, lake, or ocean from where it came but about half of irrigation water does not return to the original source due to evaporation, plant transpiration, and loss during transport, e.g., leaking pipes. Total withdrawals of water in the U.S. actually decreased slightly from 1980 to 2005, despite a steadily increasing population. This is because the two largest categories of water use (thermoelectric and irrigation) stabilized or decreased over that time period due to better water management and conservation. In contrast, public supply water demand increased steadily from 1950 (when estimates began) through 2005. Approximately 77% of the water for offstream use in the U.S. in 2005 came from surface water and the rest was from groundwater.

The bars that stand out most are the yellow ones -- freshwater for electricity production. Electricity water use increased almost 400 percent from 1950 to 2005, but dropped about 19 percent from 2005 to 2015. Irrigation water use increased by about 29 percent since 1950—it takes more water to grow food for our increasing population. Notice how after 1980 water use started to decrease a bit, possibly due to the Nation making more use of water-conservation measures. The purple public-supply boxes are important. Notice how they continue on an uptrend. Public-supply water (water withdrawn by the local county and city water departments and delivered to homes and businesses) goes to serve the Nation's normal water uses, such as supplying industries, restaurants, and homes with water. The Nation's ever-increasing population demands ever-increasing supplies of water. Source USGS
Trends in total water withdrawals, 1950-2015

This chart shows the trends in freshwater and saline-water withdrawals for the Nation from 1950 to 2015. What is remarkable about this chart is that it shows that the Nation's water use peaked in 1980 and has been fairly steady since then. Many of the stresses for greater water use have risen since 1980, such as population, the need to grow more food (irrigation), more industry, etc, yet total water use has not risen. This shows that water conservation efforts and greater efficiencies in using water have had a positive effect in the last 35 year
Trends in total freshwater withdrawals by source, 1950-2015

This chart shows the trends in surface-water, groundwater, and total-water withdrawals for the Nation from 1950 to 2015. Notice how the relative amounts of surface- and groundwater withdrawals (in percentages) has remained fairly constant. About three-fourths of the water used in America comes from surface water.
Trends in estimated use of water in the United States, 1950-2015

Source: Trends in Water use in the U.S. Estimated use of water in the United States in 2015
Circular 1441
![4: Countries with water threat in 1995 and predicted water-stress countries in 2025. Reference: [21]. Indeed, Egypt is no exception due to increasing population. by 2025, population -whom](https://www.researchgate.net/profile/Mohamed-Abd-El-Kodous/publication/332910952/figure/fig4/AS:755963602690052@1557247176761/Countries-with-water-threat-in-1995-and-predicted-water-stress-countries-in-2025.png)
Countries with water threat in 1995 and predicted water-stress countries in 2025. Water stress is defined as having a high percentage of water withdrawal compared to total available water in the area. Source:
Philippe Rekacewicz (Le Monde diplomatique), February 2006.

In many parts of the country, competing demands for water create stress in local and regional watersheds. Map shows a “water supply stress index” for the U.S. based on observations, with widespread stress in much of the Southwest, western Great Plains, and parts of the Northwest. Watersheds are considered stressed when water demand (from power plants, agriculture, and municipalities) exceeds 40% (water supply stress index of 0.4) of available supply. (Figure Source: Averyt et al. 2011 ) https://www.globalchange.gov/browse/multimedia/water-stress-us#:~:text=Map%20shows%20a%20%E2%80%9Cwater%20supply,and%20parts%20of%20the%20Northwest..
Pacific Institute Launches Water and Climate Equity Strategy for United States
Water insecurity realities
More than 2.2 billion people globally lack access to safely managed drinking water (United Nations, 2019), while millions of people in the United States are without clean, reliable water, lack basic plumbing, or rely on water systems with Safe Drinking Water Act violations.
Today, the Human Right to Water is formally recognized by the United Nations, the State of California, and dozens of global businesses. Yet, the United States as a whole has yet to recognize the Human Right to Water or meet the United Nations Sustainable Development Goals for clean water and sanitation (SDG 6), climate action (SDG 13), or reduced inequalities (SDG 10). Source : Pacific Institute https://pacinst.org/our-focus-areas/
Case Study: The Aral Sea
The Aral Sea is a lake located east of the Caspian Sea between Uzbekistan and Kazakhstan in central Asia (see Figure Map of Aral Sea Area). This area is part of the Turkestan desert, which is the fourth largest desert in the world; it is produced from a rain shadow effect by Afghanistan's high mountains to the south. Due to the arid and seasonally hot climate there is extensive evaporation and limited surface waters in general. Summer temperatures can reach 60° C (140° F)! The water supply to the Aral Sea is mainly from two rivers, the Amu Darya and Syr Darya, which carry snowmelt from mountainous areas. In the early 1960s the then-Soviet Union diverted the Amu Darya and Syr Darya Rivers for irrigation of one of the driest parts of Asia to produce rice, melons, cereals, and especially cotton. The Soviets wanted cotton or “white gold” to become a major export. They were successful and today Uzbekistan is one of the world's largest exporters of cotton. Unfortunately this action essentially eliminated any river inflow to the Aral Sea and caused it to disappear almost completely.
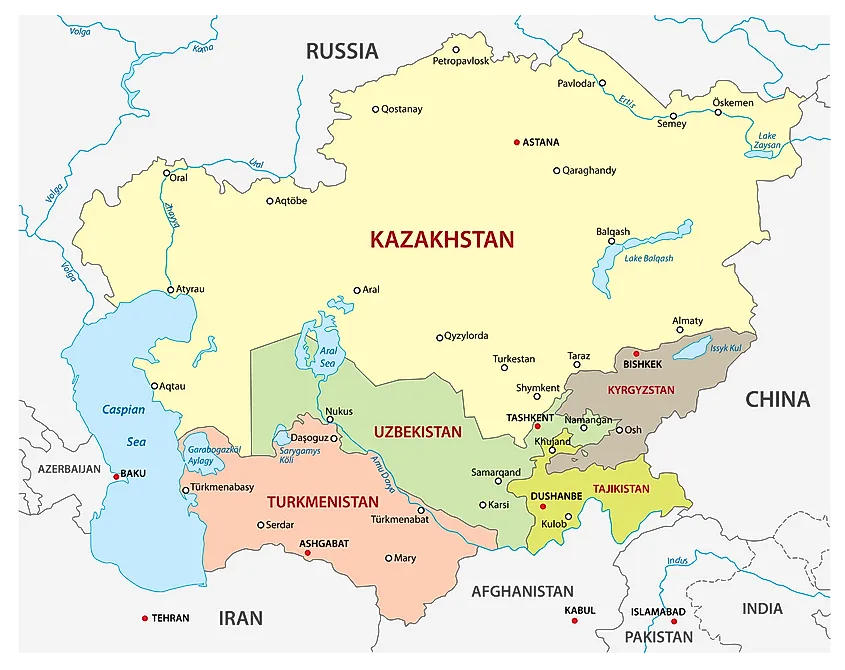
Map showing the location of the Aral Sea in Central Asia. Source: World Atlas https://www.worldatlas.com/seas/aral-sea.html
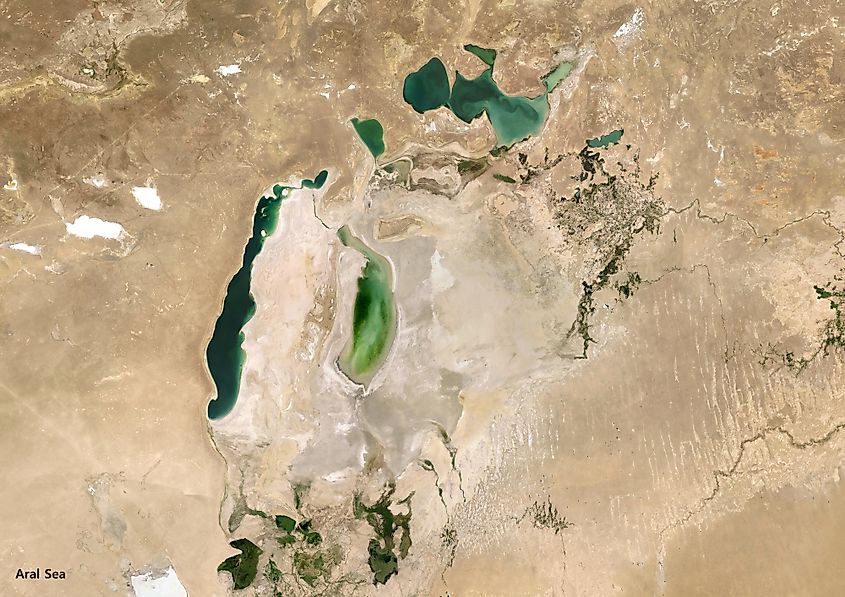
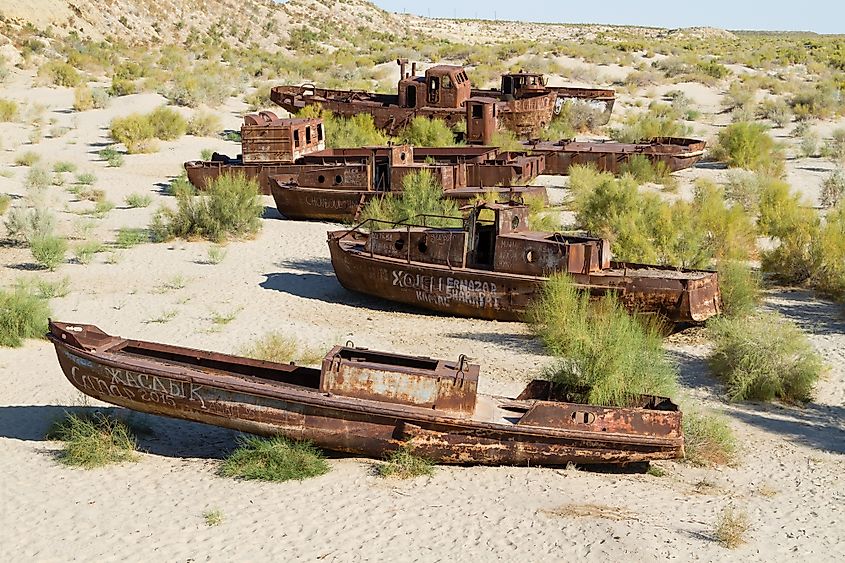
In 1960 Aral Sea was the fourth largest inland water body; only the Caspian Sea, Lake Superior, and Lake Victoria were larger. Since then, it has progressively shrunk due to evaporation and lack of recharge by rivers. Before 1965 the Aral Sea received 20–60 km of fresh water per year from rivers and by the early 1980s it received none. By 2007 the Aral Sea shrank to about 10% of its original size and its salinity increased from about 1% dissolved salt to about 10% dissolved salt, which is 3 times more saline than seawater. These changes caused an enormous environmental impact. A once thriving fishing industry is dead as are the 24 species of fish that used to live there; the fish could not
adapt to the more saline waters. The current shoreline is tens of kilometers from former fishing towns and commercial ports. Large fishing boats lie in the dried up lakebed of dust and salt ( see adandoned boats above)
The wetlands of the two river deltas and their associated ecosystems have disappeared. The regional climate is drier and has greater temperature extremes due to the absence of moisture and moderating influence from the lake. In 2003 some lake restoration work began on the northern part of the Aral Sea and it provided some relief by raising water levels and reducing salinity somewhat. The southern part of the Aral Sea has seen no relief and remains nearly completely dry. The destruction of the Aral Sea is one of the planet’s biggest environmental disasters and it is caused entirely by humans. Lake Chad in Africa is another example of a massive lake that has nearly disappeared for the same reasons as the Aral Sea. Aral Sea and Lake Chad are the most extreme examples of large lakes destroyed by unsustainable diversions of river water. Other lakes that have shrunk significantly due to human diversions of water include the Dead Sea in the Middle East, Lake
Manchar in Pakistan, and Owens Lake and Mono Lake, both in California.
Water Pollution:
Water pollution is the contamination of water sources by substances which make the water unusable for drinking, cooking, cleaning, swimming, and other activities. Pollutants include chemicals, trash, bacteria, and parasites. All forms of pollution eventually make their way to water. Air pollution settles onto lakes and oceans. Land pollution can seep into an underground stream, then to a river, and finally to the ocean. Thus, waste dumped in a vacant lot can eventually pollute a water supply.
Water pollutants may cause disease or act as poisons. Bacteria and parasites in poorly treated sewage may enter drinking water supplies and cause digestive problems such as cholera and diarrhea. Hazardous chemicals, pesticides, and herbicides from industries, farms, homes and golf courses can cause acute toxicity and immediate death, or chronic toxicity that can lead to neurological problems or cancers. Many water pollutants enter our bodies when we use water for drinking and food preparation. The pollutants enter the digestive tract. From there, they can reach other organs in the body and cause various illnesses. Chemicals come in contact with the skin from washing clothes, or from swimming in polluted water and may lead to skin irritations. Hazardous chemicals in water systems can also affect the animals and plants which live there. Sometimes these organisms will survive with the chemicals in their systems, only to be eaten by humans who may then become mildly ill or develop stronger toxic symptoms. The animals and plants themselves may die or not reproduce properly.
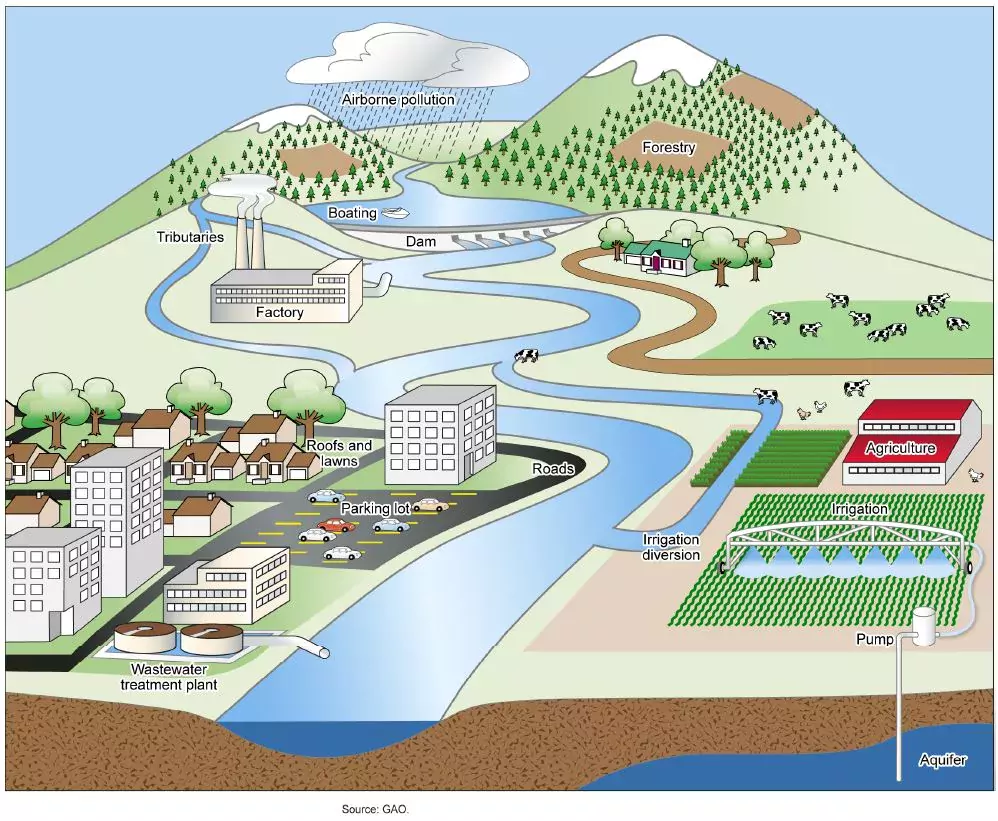
Nonpoint Source Pollution (NPS)
NPS pollution generally results from land runoff, precipitation, atmospheric deposition, drainage, seepage or hydrologic modification. NPS pollution, unlike pollution from industrial and sewage treatment plants, comes from many diffuse sources. NPS pollution is caused by rainfall or snowmelt moving over and through the ground. As the runoff moves, it picks up and carries away natural and human-made pollutants, finally depositing them into lakes, rivers, wetlands, coastal waters and ground waters.
- Excess fertilizers, herbicides and insecticides from agricultural lands and residential areas
- Oil, grease and toxic chemicals from urban runoff and energy production
- Sediment from improperly managed construction sites, crop and forest lands, and eroding streambanks
- Salt from irrigation practices and acid drainage from abandoned mines
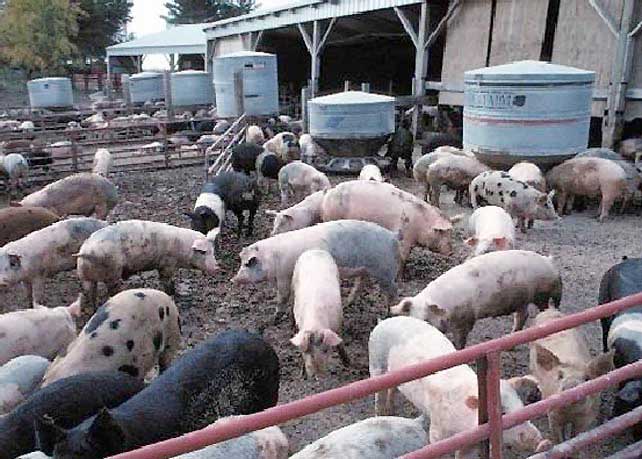
- Bacteria and nutrients from livestock, pet wastes and faulty septic systems
- Atmospheric deposition and hydromodification
States report that nonpoint source pollution is the leading remaining cause of water quality problems. The effects of nonpoint source pollutants on specific waters vary and may not always be fully assessed. However, we know that these pollutants have harmful effects on drinking water supplies, recreation, fisheries and wildlife.
Nonpoint Sources vs. Point Sources
The term "nonpoint source" is defined to mean any source of water pollution that does not meet the legal definition of "point source" in section 502(14) of the Clean Water Act: Summary of the Clean Water Act https://www.epa.gov/laws-regulations/summary-clean-water-act
The term "point source" means any discernible, confined and discrete conveyance, including but not limited to any pipe, ditch, channel, tunnel, conduit, well, discrete fissure, container, rolling stock, concentrated animal feeding operation, or vessel or other floating craft, from which pollutants are or may be discharged. This term does not include agricultural storm water discharges and return flows from irrigated agriculture.
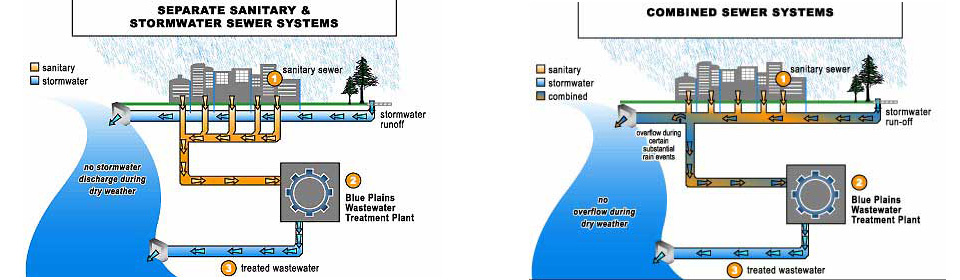
When it rains excessively, a combined sewer system may not be able handle the volume of water, and some of the combined runoff and raw sewage will overflow from the system, discharging directly into the nearest waterbody without being treated. This combined sewer overflow (CSO) is considered point source pollution, and can cause severe damage to human health and the environment.
The National Environmental Policy Act (NEPA) was signed into law on January 1, 1970. NEPA requires federal agencies to assess the environmental effects of their proposed actions prior to making decisions. The range of actions covered by NEPA is broad and includes:
- making decisions on permit applications,
- adopting federal land management actions, and
- constructing highways and other publicly-owned facilities.
Using the NEPA process, agencies evaluate the environmental and related social and economic effects of their proposed actions. Agencies also provide opportunities for public review and comment on those evaluations.
The National Environmental Policy Act (NEPA) was one of the first laws ever written that establishes the broad national framework for protecting our environment. NEPA's basic policy is to assure that all branches of government give proper consideration to the environment prior to undertaking any major federal action that significantly affects the environment.
NEPA requirements are invoked when airports, buildings, military complexes, highways, parkland purchases, and other federal activities are proposed. Environmental Assessments (EAs) and Environmental Impact Statements (EISs), which are assessments of the likelihood of impacts from alternative courses of action, are required from all Federal agencies and are the most visible NEPA requirements. Source: EPA https://www.epa.gov/nepa/what-national-environmental-policy-act
The Clean Water Act: The Clean Water Act (CWA) establishes the basic structure for regulating discharges of pollutants into the waters of the United States and regulating quality standards for surface waters. The basis of the CWA was enacted in 1948 and was called the Federal Water Pollution Control Act, but the Act was significantly reorganized and expanded in 1972. "Clean Water Act" became the Act's common name with amendments in 1972. Under the Clean Water Act, EPA has implemented pollution control programs such as setting wastewater standards for industry. Furthermore, the EPA has also developed national water quality criteria recommendations for pollutants in surface waters.
Drinking Water:
According to the World Health Organization safe and readily available water is important for public health, whether it is used for drinking, domestic use, food production or recreational purposes. Improved water supply and sanitation, and better management of water resources, can boost countries’ economic growth and can contribute greatly to poverty reduction.
In 2010, the UN General Assembly explicitly recognized the human right to water and sanitation. Everyone has the right to sufficient, continuous, safe, acceptable, physically accessible and affordable water for personal and domestic use.
Sustainable Development Goal target 6.1 calls for universal and equitable access to safe and affordable drinking water. The target is tracked with the indicator of “safely managed drinking water services” – drinking water from an improved water source that is located on premises, available when needed, and free from fecal and priority chemical contamination.
In 2020, 5.8 billion people used safely managed drinking-water services – that is, they used improved water sources located on premises, available when needed, and free from contamination. The remaining 2 billion people without safely managed services in 2020 included:
- 1.2 billion people with basic services, meaning an improved water source located within a round trip of 30 minutes;
- 282 million people with limited services, or an improved water source requiring more than 30 minutes to collect water;
- 368 million people taking water from unprotected wells and springs; and
- 122 million people collecting untreated surface water from lakes, ponds, rivers and streams.
Contaminated water and poor sanitation are linked to transmission of diseases such as cholera, diarrhoea, dysentery, hepatitis A, typhoid and polio. Absent, inadequate, or inappropriately managed water and sanitation services expose individuals to preventable health risks. This is particularly the case in health care facilities where both patients and staff are placed at additional risk of infection and disease when water, sanitation and hygiene services are lacking. Globally, 15% of patients develop an infection during a hospital stay, with the proportion much greater in low-income countries.
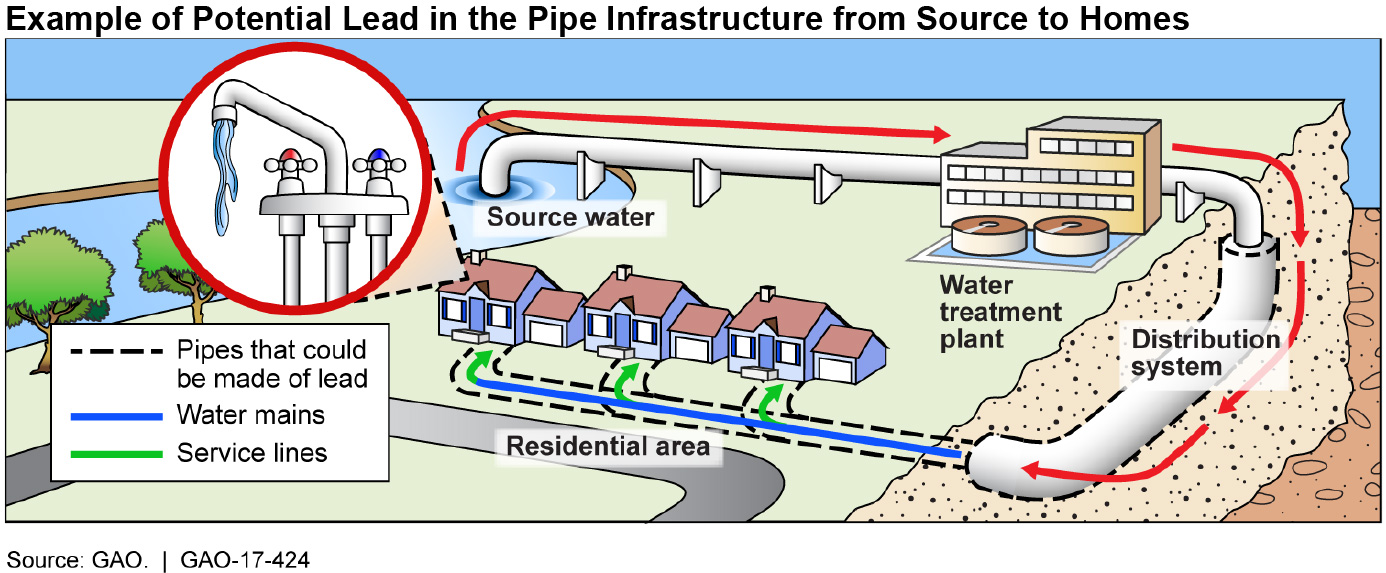
Inadequate management of urban, industrial and agricultural wastewater means the drinking-water of hundreds of millions of people is dangerously contaminated or chemically polluted. Natural presence of chemicals, particularly in groundwater, can also be of health significance, including arsenic and fluoride, while other chemicals, such as lead, may be elevated in drinking-water as a result of leaching from water supply components in contact with drinking-water.
Some 829 000 people are estimated to die each year from diarrhoea as a result of unsafe drinking-water, sanitation and hand hygiene. Yet diarrhoea is largely preventable, and the deaths of 297 000 children aged under 5 years could be avoided each year if these risk factors were addressed. Where water is not readily available, people may decide handwashing is not a priority, thereby adding to the likelihood of diarrhoea and other diseases.
Diarrhoea is the most widely known disease linked to contaminated food and water but there are other hazards. In 2017, over 220 million people required preventative treatment for schistosomiasis – an acute and chronic disease caused by parasitic worms contracted through exposure to infested water.
In many parts of the world, insects that live or breed in water carry and transmit diseases such as dengue fever. Some of these insects, known as vectors, breed in clean, rather than dirty water, and household drinking water containers can serve as breeding grounds. The simple intervention of covering water storage containers can reduce vector breeding and may also reduce fecal contamination of water at the household level ( WHO https://www.who.int/news-room/fact-sheets/detail/drinking-water )
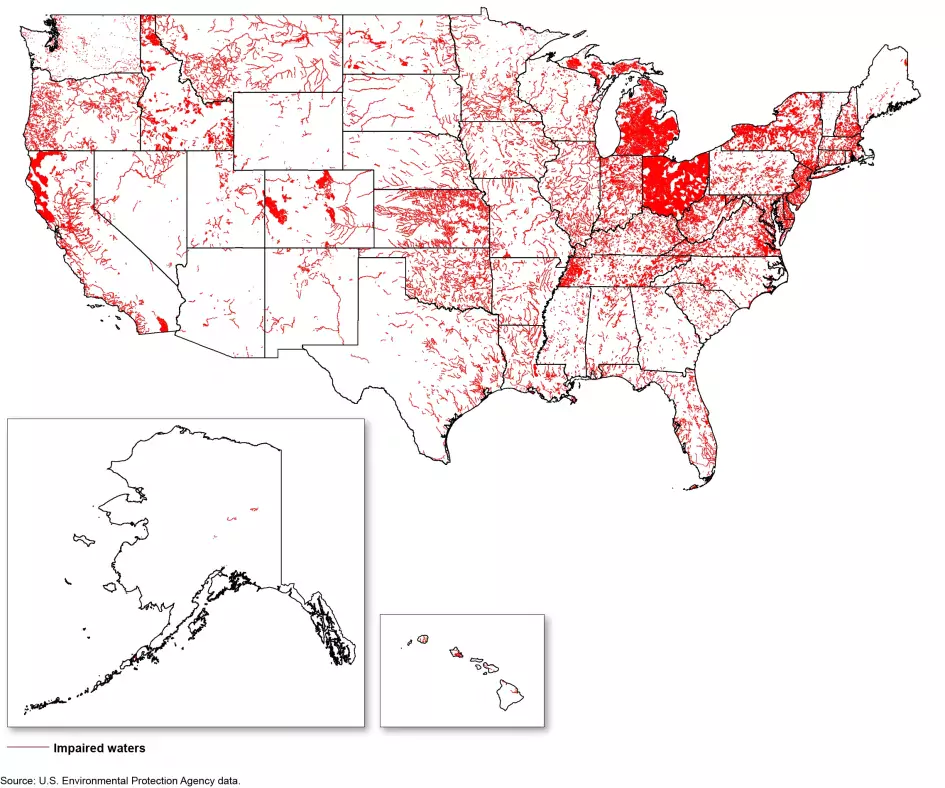
In October of 2022 was the 50th anniversary of the Clean Water Act, which was passed by Congress on October 18, 1972—establishing a nationwide approach to improving the quality of our nation’s lakes, rivers, streams, and other water bodies. Over the last 50 years, the health of our waters has improved, but threats to water safety remain.
The CWA requires the Environmental Protection Agency (EPA)—along with states, tribes, and territories—to monitor the quality of U.S. lakes, rivers, streams, estuaries, and other water bodies. EPA and states are also required to list water bodies that are impaired by pollutants and to plan for cleaning them up. Yet, EPA’s most recent report (from 2017) says that only about half of U.S. waters have been assessed to date, meaning that quality of the other half has not been assessed and their status is unknown.
Ensuring safe drinking water
Under the Safe Drinking Water Act (SDWA), EPA establishes legally enforceable standards that limit the levels of specific contaminants in drinking water. EPA identifies unregulated contaminants, monitors them, and determines whether to regulate them based on things like how dangerous they are to public health, and how often they occur. The agency has issued standards for around 90 contaminants to date.
However, EPA could more efficiently collect data on unregulated contaminants in order to determine whether they need to be regulated. Additionally, public water systems must comply with monitoring, reporting, and other requirements established by EPA and responsible states. But the data that states reported to EPA did not always reflect the frequency of health-based and monitoring violations by community water systems or the status of enforcement actions.
Most Recent Map of Impaired Waters (As of 2015)
Contaminated water: Both the Clean Water Act and the Safe Drinking Water Act defines the term "contaminant" as meaning any physical, chemical, biological, or radiological substance or matter in water. Therefore, the law defines "contaminant" very broadly as being anything other than water molecules. Drinking water may reasonably be expected to contain at least small amounts of some contaminants. Some drinking water contaminants may be harmful if consumed at certain levels in drinking water while others may be harmless. The presence of contaminants does not necessarily indicate that the water poses a health risk.
Limited monitoring makes it difficult to detect and warn of harmful substances in water bodies. For example, we recently reported that limited monitoring for harmful algal blooms (HABs) in fresh water, may hamper efforts to identify the risks blooms could pose to human health and aquatic life. Harmful algal blooms, or HABs, occur when colonies of algae — simple plants that live in the sea and freshwater — grow out of control and produce toxic or harmful effects on people, fish, shellfish, marine mammals and birds. The human illnesses caused by HABs, though rare, can be debilitating or even fatal. All 50 states have experienced harmful algal blooms and, according to federal agencies, may experience more blooms in the future with climate change and warming waters.

Imagery of the Western Lake Erie harmful algal bloom from September 26, 2017. The scum shown here near downtown Toledo stretched all the way to Lake Ontario. This photo is from Landsat-8 (a NASA/USGS satellite Source: https://oceanservice.noaa.gov/facts/hab-solutions.html
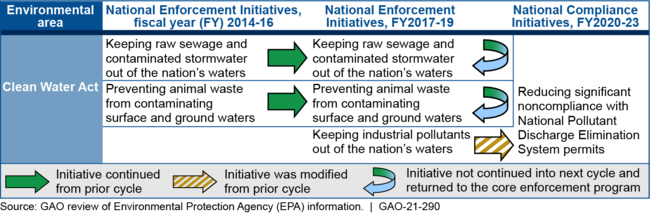
Since 2015, the Environmental Protection Agency (EPA) has modified one of its three national initiatives emphasizing compliance with the Clean Water Act and has discontinued two others (see fig below). The goal of the modified initiative is to reduce significant noncompliance with National Pollutant Discharge Elimination System (NPDES) permits by half by the end of fiscal year 2022. Such permits set limits on discharges of wastewater from point sources, such as a pipe from an industrial facility. This goal supports EPA's strategic objective to increase compliance with environmental laws in its strategic plan for fiscal years 2018-2022. EPA discontinued its initiatives focused on animal waste pollution and raw sewage and stormwater runoff, returning these areas to the core enforcement program in 2018 and 2019, respectively. As a result, these areas no longer receive the heightened attention and focused resources of the national initiatives, but the agency still pursues enforcement actions when needed.
Changes in EPA's Clean Water Act National Initiatives(Source: https://www.gao.gov/products/gao-21-290)
One key program under the CWA established requirements for regulating and limiting point sources of pollution—pollution that is discharged into waters from sources such as pipes from industrial facilities and wastewater treatment plants.
This type of pollution is allowed, but requires permits. Permit holders must self-report discharges and noncompliance with water quality requirements. In 2021, the U.S. Government Accountability Office (GAO) found that EPA lacks reliable information needed to ensure polluters are complying with their permits. We also recommended steps to improve that will help EPA identify and reduce illegal discharges.
While point source pollution is an important issue, the leading cause of water pollution is nonpoint sources. These sources come from runoff that carries sediment, oil, bacteria, toxins, and other pollutants from farms, yards, and paved areas (e.g., streets and parking lots) into nearby waters. Such pollution can harm fish and other aquatic life, lead to the development of harmful algal blooms, and contribute to ocean acidification in coastal waters, an emerging threat to marine life on which was previously by the GAO.

This USGS map shows the number of PFAS detected in tap water samples from select sites across the nation. The findings are based on a USGS study of samples taken between 2016 and 2021 from private and public supplies at 716 locations. The map does not represent the only locations in the U.S. with PFAS. Sources/Usage Public Domain. USGS Image. https://www.usgs.gov/media/images/pfas-select-us-tapwater-locations. https://www.usgs.gov/news/national-news-release/tap-water-study-detects-pfas-forever-chemicals-across-us
Before the passage of the Clean Water Act, large numbers of our nation’s lakes, rivers, and streams, were polluted with raw sewage, industrial chemicals, and dangerous metals. For example, in Washington, D.C., the Potomac River was so polluted with sewage that the smell across parts of the National Mall was nearly unbearable. The Cuyahoga River in Ohio was so polluted with oil and debris that it used to catch on fire!
:focal(685x657:686x658)/https://tf-cmsv2-smithsonianmag-media.s3.amazonaws.com/filer/e4/13/e4136a97-b510-432c-8089-15a4d7ba50f7/gettyimages-515303088.jpg)
Original Caption: Firemen stand on a bridge over the Cuyahoga River to spray water on the tug Arizona, as a fire, started in an oil slick on the river, sweeps the docks at the Great Lakes Towing Company site in Cleveland Nov., 1st. The blaze destroyed three tugs, three buildings, and the ship repair yards. Bettmann / Contributor via Getty Images (https://www.smithsonianmag.com/history/cuyahoga-river-caught-fire-least-dozen-times-no-one-cared-until-1969-180972444/)
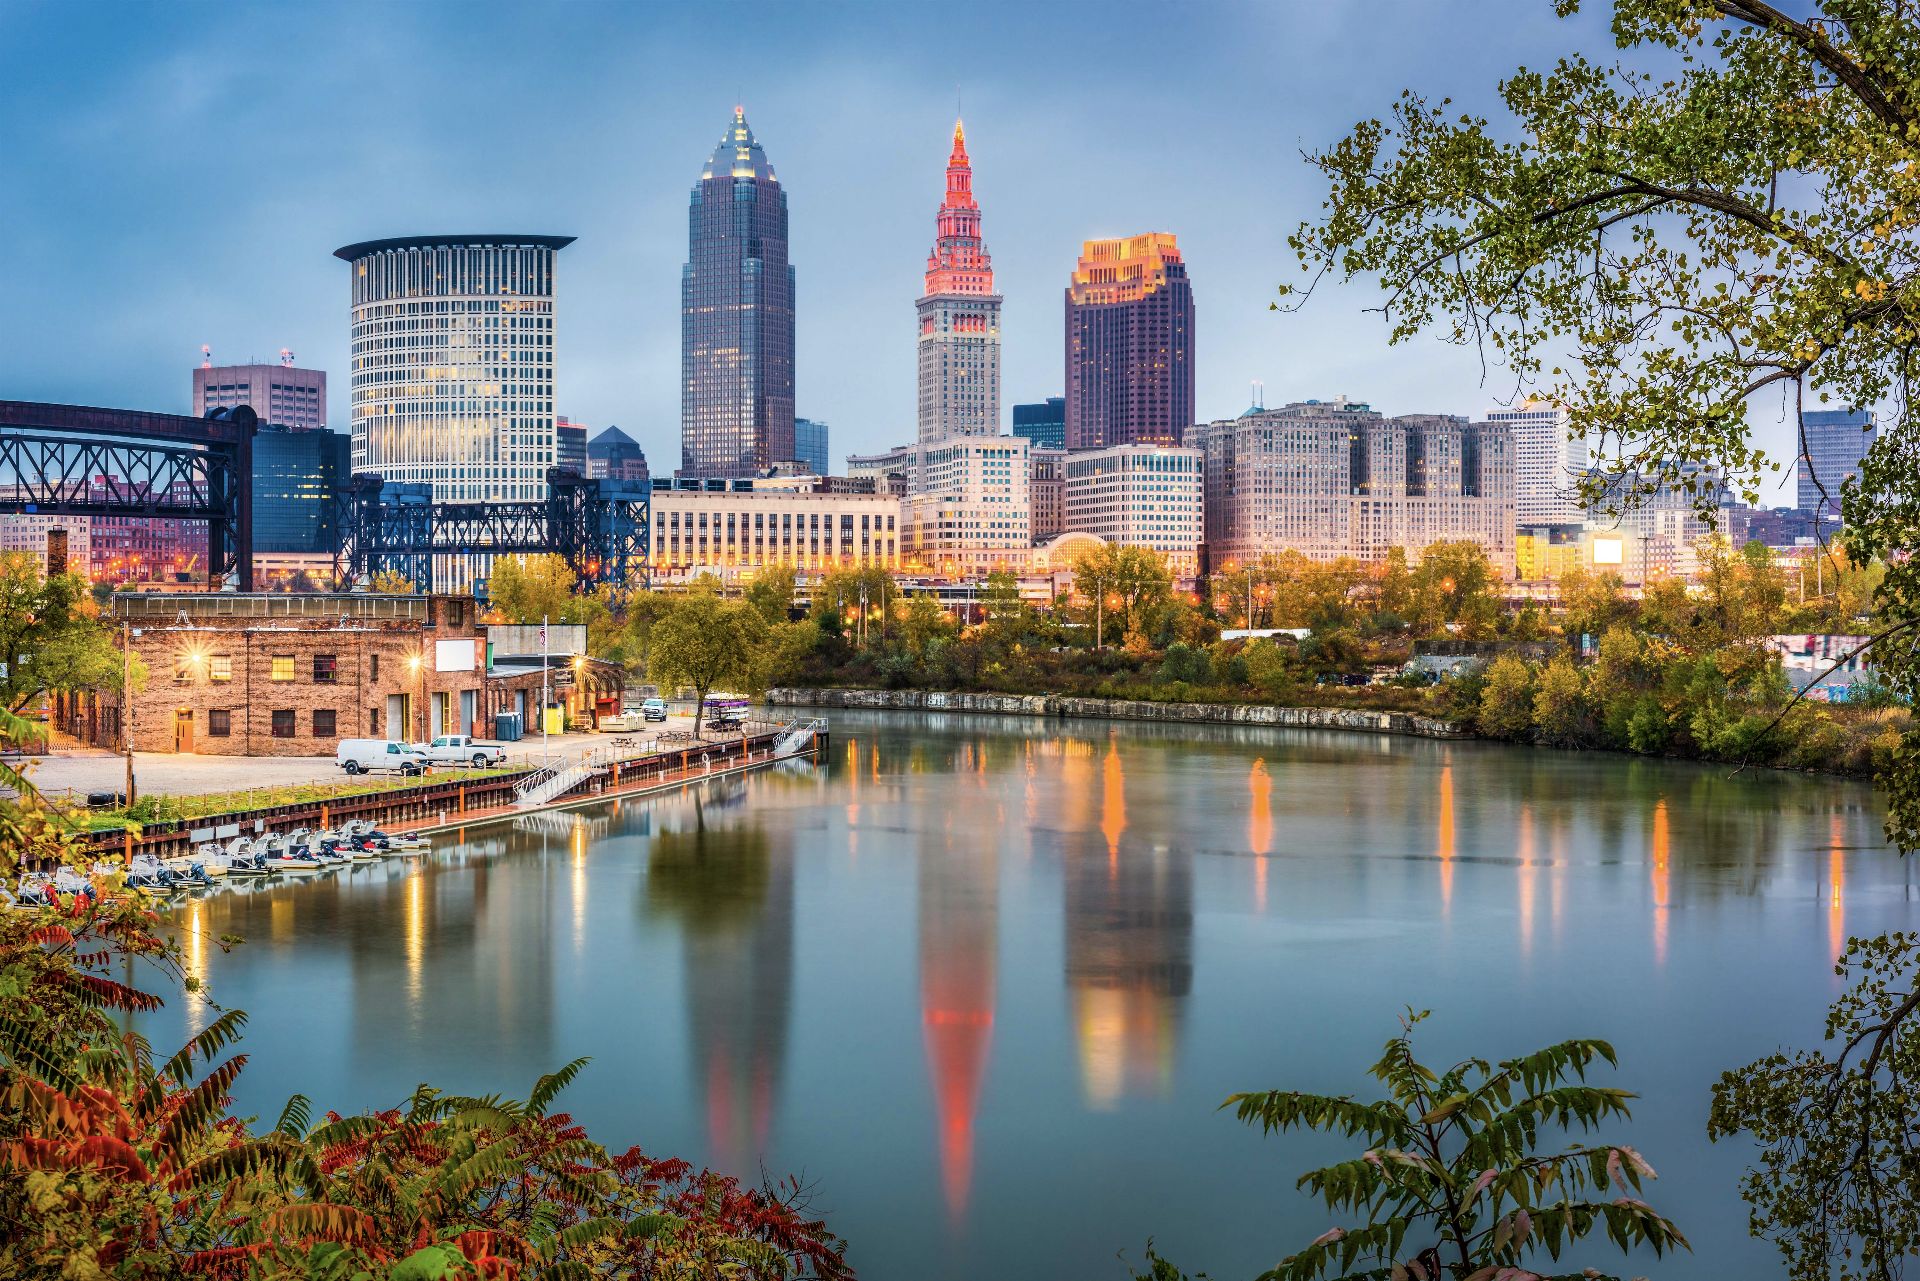
The Cuyahoga's Comeback Source; https://www.americanrivers.org/cuyahoga50/index.html
While the sources of pollution that created such situations have largely been addressed, threats from more dispersed sources—such as stormwater runoff that carries pollutants into our waters—will require further actions. Emerging threats resulting from a changing climate also need to be addressed. The key to tackling these threats will require using the tools provided by the Clean Water Act. But more action may be needed to strengthen the Act and help it meet the goals established half a century ago.
Lead in Drinking Water U.S. Government Accountability Office (GAO) https://www.gao.gov/water-quality-and-protection
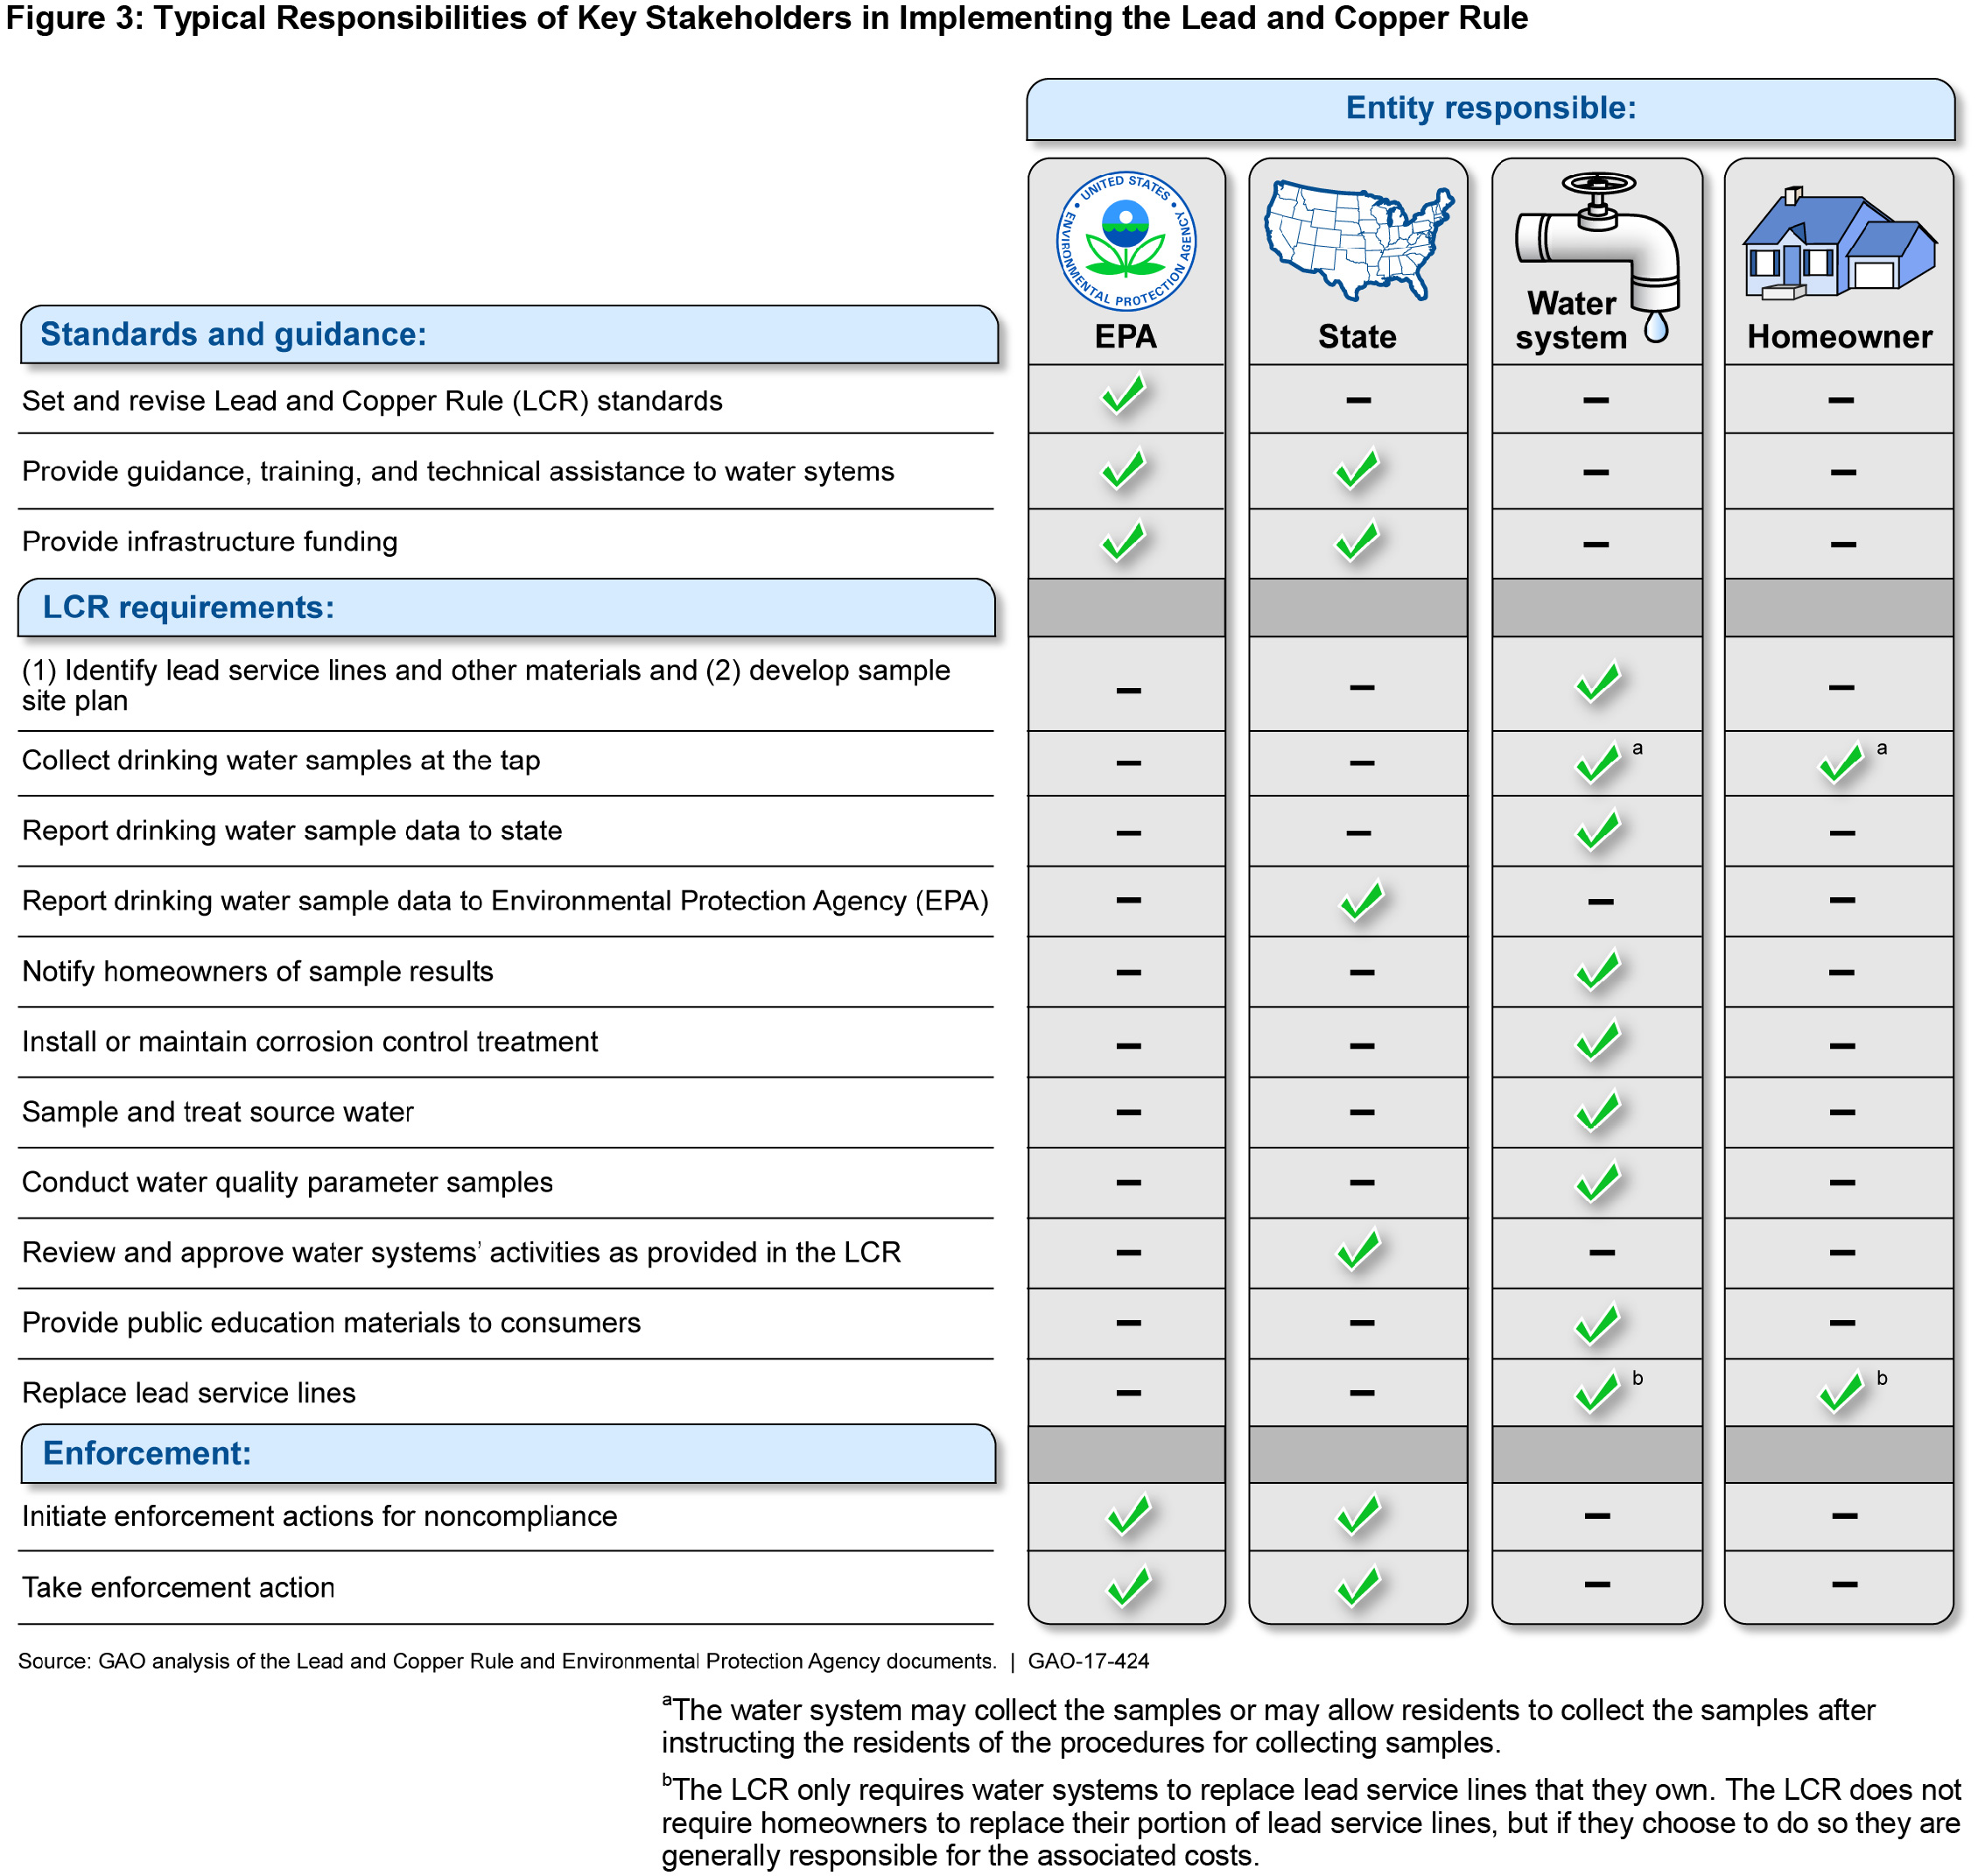
Additionally, the Lead and Copper Rule requires water systems to test for lead and treat water to help prevent corroded pipes from leaching lead. The 68,000 water systems serving the majority of U.S. residents are subject to this rule, and must test in high-risk areas near lead pipes. However, many lead pipe locations are unknown. EPA should collect data on lead pipes to improve its oversight of the rule. Lead in school drinking water is also of concern because it is a daily source of water for over 50 million children. EPA and the Department of Education should promote lead testing and improve guidance for school districts and in child care settings.
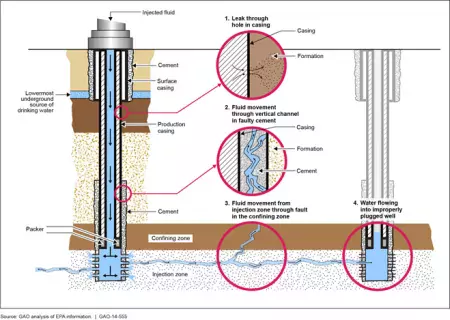
Under the SDWA, EPA is also charged with protecting underground sources of drinking water from contamination. It does so through the Underground Injection Control (UIC) program, which regulates the injection of wastewater into underground wells. However, EPA has not collected specific inspection or complete and consistent enforcement information or consistently conducted oversight activities to assess whether state and EPA-managed UIC programs for oil and gas wastewater disposal wells are protecting underground sources of drinking water.

Water is the only substance that occurs naturally on Earth in three forms: solid, liquid and gas. Shallow groundwater is the largest reservoirs of fresh water however, it is not easily located. Although rivers and lakes are the most heavily used water resources, they represent only a tiny amount of the world’s water. The water cycle shows the movement of water through different reservoirs, which include oceans, atmosphere, glaciers, groundwater, lakes, rivers, and biosphere. Solar energy and gravity drive the motion of water in the water cycle. Precipitation is a major control of fresh water availability, and it is unevenly distributed around the globe. Flowing water from rain and melted snow on land enters river channels by surface runoff and groundwater seepage.
Lakes can also be an excellent source of fresh water for human use. They usually receive water from surface runoff and groundwater discharge. The Great Lakes hold 21% of the world's surface fresh water. Although glaciers represent the largest reservoir of fresh water, they generally are not used as a water source because they are located too far from most people. If Earth’s climate continues to warm, the melting glaciers will cause an additional rise in sea level.
An Earth material that is capable of supplying groundwater from a well at a useful rate—i.e., it has relatively high permeability and medium to high porosity—is called an aquifer. A spring is a water resource formed when the side of a hill, a valley bottom or other excavation intersects groundwater at or below the local water table, below which the subsurface material is saturated with water. Groundwater and surface water (rivers, lakes, swamps, and reservoirs) are strongly interrelated because both are part of the same overall resource. Major groundwater removal (from pumping or drought) can lower the levels of surface water and vice versa. People need water to produce the food, energy, and mineral resources they use—commonly large amounts of it.
The water demand of an area is a function of the population and other uses of water. The water crisis refers to a global situation where people in many areas lack access to sufficient water or clean water or both. More than 2.2 billion people globally lack access to safely managed drinking water (United Nations, 2019), while millions of people in the United States are without clean, reliable water, lack basic plumbing, or rely on water systems with Safe Drinking Water Act violations. Today, the Human Right to Water is formally recognized by the United Nations, the State of California, and dozens of global businesses. Yet, the United States as a whole has yet to recognize the Human Right to Water or meet the United Nations Sustainable Development Goals for clean water and sanitation (SDG 6), climate action (SDG 13), or reduced inequalities (SDG 10)
Water pollution is the contamination of water sources by substances which make the water unusable for drinking, cooking, cleaning, swimming, and other activities. Pollutants include chemicals, trash, bacteria, and parasites. Non-point pollution (NPS) generally results from land runoff, precipitation, atmospheric deposition, drainage, seepage or hydrologic modification. The term "point source" means any discernible, confined and discrete conveyance. When it rains excessively, a combined sewer system may not be able handle the volume of water, and some of the combined runoff and raw sewage will overflow from the system, discharging directly into the nearest waterbody without being treated. Under the Safe Drinking Water Act (SDWA), EPA establishes legally enforceable standards that limit the levels of specific contaminants in drinking water. At least 45% of the nation’s tap water is estimated to have one or more types of the chemicals known as per- and polyfluorinated alkyl substances, or PFAS. Before the passage of the Clean Water Act, large numbers of our nation’s lakes, rivers, and streams, were polluted with raw sewage, industrial chemicals, and dangerous metals.
Basic Information about Nonpoint Source (NPS) Pollution
https://www.epa.gov/nps/basic-information-about-nonpoint-source-nps-pollution
Monitoring Unregulated Contaminants in Drinking Water
Overview of Total Maximum Daily Loads (TMDLs)
https://www.epa.gov/tmdl/overview-total-maximum-daily-loads-tmdls
Explore Search: Common Water Issues
https://www.usgs.gov/search?keywords=Common%20Water%20Issues
Tap Water study detects PFAS across US
50 Years After the Clean Water Act—Gauging Progress
https://www.gao.gov/blog/50-years-after-clean-water-act-gauging-progress
NASA TERRA Why Citizen Science for Water Quality?
Water Quality
Igor Shiklomanov's chapter "World fresh water resources" in Peter H. Gleick (editor), 1993, Water in Crisis: A Guide to the World's Fresh Water Resources (Oxford University Press, New York).
NASA Earth Observatory https://earthobservatory.nasa.gov/global-maps/GPM_3IMERGM
Colorado River Basin map. https://www.usgs.gov/media/images/colorado-river-basin-map
Michigan State University https://project.geo.msu.edu/geogmich/watershed.html
U.S. Department of the Interior, U.S. Geological Survey Persistent URL: http://pubsdata.usgs.gov/pubs/circ/circ1186/
Page Contact Information: USGS Publishing Network Last modified: Friday, January 11 2013, 12:27:14 PM
Water Availability and Use Science Program
By: Cheryl A. Dieter, Molly A. Maupin, Rodney R. Caldwell, Melissa A. Harris, Tamara I. Ivahnenko, John K. Lovelace, Nancy L. Barber, and Kristin S. Linsey
https://doi.org/10.3133/cir1441
National Oceanic Atmospheric Administration (NOAA) https://oceanservice.noaa.gov/education/tutorial_pollution/03pointsource.html#:~:text=The%20U.S.%20Environmental%20Protection%20Agency%20(EPA)%20defines%20point%20source%20pollution,common%20types%20of%20point%20sources
Changes in EPA's Clean Water Act National Initiatives https://www.gao.gov/products/gao-21-290
Types of Drinking Water Contaminants https://www.epa.gov/ccl/types-drinking-water-contaminants
Lead in Drinking Water U.S. Government Accountability Office (GAO) https://www.gao.gov/water-quality-and-protection
U.S. Government Accountability Office https://www.gao.gov/blog/2018/03/22/bottoms-up-to-clean-drinking-water
