7 Air Pollution: What are we breathing?
Composition and Structure of the Atmosphere
Atmosphere refers to the layer of gases that surrounds Earth and is held in place by Earth’s gravitational attraction (gravity). The mix of gases in the atmosphere forms a complex system organized into layers that together support life on Earth. Although there are numerous gases the top four gases make up 99.998 % of the volume of clean dry air (unpolluted air that does not contain water vapor). Of this dry composition of the atmosphere nitrogen, by far, is the most common (78%).
.png?revision=1&size=bestfit&width=549&height=349)
Figure: Emissions from this power plant in New Mexico contained excessive amounts of sulfur dioxide. Image from National Parks Service (Public Domain).
Nitrogen dilutes oxygen and prevents rapid or instantaneous burning at the Earth’s surface, as oxygen gas is a necessary reactant of the combustion process. Nitrogen is also needed and used by living things to make proteins, though as nitrogen gas, N2, it is unavailable to most living things. Oxygen is used by all living things to make molecules that are essential for life. It is also essential for aerobic respiration as well as combustion or burning. Argon is a non-reactive gas and we use it in light bulbs, in double-pane windows, and to preserve priceless documents such as the original Declaration of Independence and the Constitution. Carbon dioxide is an essential gas used by plants and other organisms to make sugar (food) through photosynthesis. This process is essential for other life as well because during photosynthesis, water molecules are split apart and their oxygen is released back to the atmosphere. Carbon dioxide also acts as a blanket that prevents the escape of heat into outer space. The atmosphere is rarely, if ever, completely dry. Water vapor (water in a ‘gas’ state) is usually present up to about 4% of the total volume depending on location. In the Earth’s desert regions (30° N/S) when dry winds are blowing, the water vapor contribution to the composition of the atmosphere will be near zero.
| Gas | Symbol | Content |
|---|---|---|
| Nitrogen | N2 | 78.08% |
| Oxygen | O2 | 20.95% |
| Argon | Ar | 0.93% |
| Carbon | CO2 | 0.03% (this and the above three add to 99.998%) |
| Neon | Ne | 18.20 parts per million |
| Helium | He | 5.20 ppm |
| Krypton | Kr | 1.10 ppm |
| Sulfur Dioxide | SO2 | 1.00 ppm |
| Methane | CH4 | 2.00 ppm |
| Hydrogen | H2 | 0.50 ppm |
| Nitrous Oxide | N2O | 0.50 ppm |
| Xenon | Xe | 0.09 ppm |
| Ozone | O3 | 0.07 ppm |
| Nitrogen Dioxide | NO2 | 0.02 ppm |
| Iodine | I2 | 0.01 ppm |
| Carbon Monoxide | CO | Trace |
| Ammonia | NH3 | Trace |
Source: National Weather Service www.srh.noaa.gov/jetstream/at…tmos_intro.htm
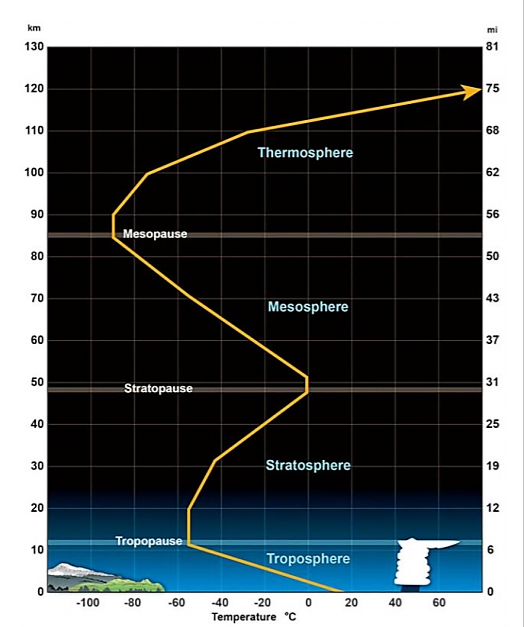
Earth’s atmosphere is divided into four distinct layers based on thermal characteristics (temperature changes), chemical composition, movement, and density. The Troposphere is the lowest layer extending from the surface up to roughly 18 km above the surface depending on location (varies from as low as 6 km to as high as 20 km). There is continuous flow and swirling of air constantly through convection currents redistributing heat and moisture around the globe. This results in the short-lived and local patterns of temperature and moisture that we call weather. Because gravity holds most air molecules close to the Earth’s surface, the troposphere is the densest of all layers, containing about 75% of the total mass of the atmosphere. The density of the gases in this layer decrease with height so the air becomes thinner. In response, the temperature in the troposphere also decreases with height. As one climbs higher, the temperature drops from an average around 17°C (62°F) at sea level to about -51°C (-60°F) at the tropopause, a sharp boundary at the top of the troposphere that limits mixing between the troposphere and the upper layers.
.png?revision=1&size=bestfit&width=579&height=693)
Figure: An average temperature profile through the lower layers of the atmosphere. Height (in miles and kilometers) is indicated along each side. Source: National Weather Service www.srh.noaa.gov/jetstream/at…atmprofile.htm
The stratosphere is the layer that extends from the tropopause up to about 50 km to 53 km above the Earth’s surface depending on location. The proportions of most gases in this layer is similar to that of the troposphere with two main exceptions: 1) there is almost no water vapor in the stratosphere and 2) the stratosphere has nearly 1,000 times more ozone (O3) than the troposphere. With only about 19% of the total mass of the atmosphere, the density of the stratosphere is significantly lower than the troposphere. However, temperature in this region increases with height as a result of heat that is produced during the formation of ozone (more on ozone in section 6.2). This heat is responsible for temperature increases from an average -51 °C (-60°F) at tropopause to a maximum of about -15°C (5°F) at the top of the stratosphere. This increase in temperature with height means warmer air is located above cooler air. This prevents “convection” as there is no upward vertical movement of the gases. The consequence of this little to no mixing of gases in the stratosphere makes it relatively calm but also means that once substances such as pollutants enter this zone, they can remain suspended for many years. The top of the stratosphere is bound by a boundary known as the stratopause.
Above the stratosphere is the mesosphere which extends to about 85 km above the Earth’s surface. The mesosphere has no ozone molecules and the other gases such as oxygen and nitrogen continue to become less dense with height. As a result, not much ultraviolet and x-ray radiation from the sun is absorbed by molecules in this layer so temperature decreases with altitude. Both the stratosphere and the mesosphere are considered the middle atmosphere.
Between about 85 km and 600 km lies the thermosphere. This layer is known as the upper atmosphere. Unlike the mesosphere, the gases in this layer readily absorb incoming high energy ultraviolet and x-ray radiation from the sun. Because of this absorption, the temperature in the thermosphere increases with height and can reach as high as 2,000°C (3,600°F) near the top depending on solar activity. However, despite the high temperature, this layer of the atmosphere would still feel very cold to our skin due to the very thin atmosphere. The high temperature indicates the amount of energy absorbed by molecules but with so few in this layer, the total number of molecules is not enough to heat our skin. There’s no sharp boundary that marks the end of the atmosphere. Pressure and density simply continue to decrease with distance until they become indistinguishable from the near-vacuum of outer space.
Ozone
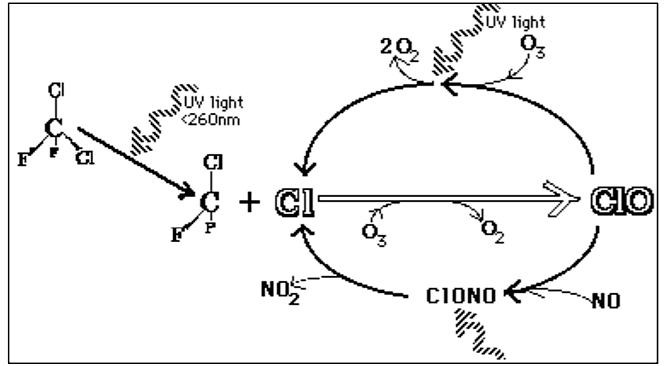
Ozone (O3) is a molecule in which three atoms of oxygen are bonded together. The oxygen gas in the air we breathe has two oxygen atoms bonded together (O2). Ozone is relatively unstable and releases its third oxygen atom readily so it oxidizes and burns things more readily than oxygen gas. This characteristic makes ozone in the troposphere (ground-level ozone) an air pollutant but in the stratosphere, ozone is essential for protecting life on Earth. Ozone in the stratosphere is formed when an oxygen molecule (O2) is broken apart into two separate oxygen atoms (O) by high-energy ultra violet (UV) solar radiation. Each of the resulting oxygen atoms (O) in turn reacts with an oxygen molecule (O2) creating ozone (O3). Once produced, ozone can absorb UV radiation breaking the molecule to regenerate an oxygen molecule and a single oxygen atom. So, while ozone is continually being replenished, it is also continually being destroyed. If the rate of ozone creation is equal to the rate of destruction, the total amount will remain the same. Because there is so much oxygen in our atmosphere, this “ozone-oxygen cycle” is continuously absorbing UV radiation.
.png?revision=1&size=bestfit&width=585&height=238)
Figure: The “ozone-oxygen cycle” showing the natural formation and breaking of ozone (O3) in the stratosphere
The Ozone Layer
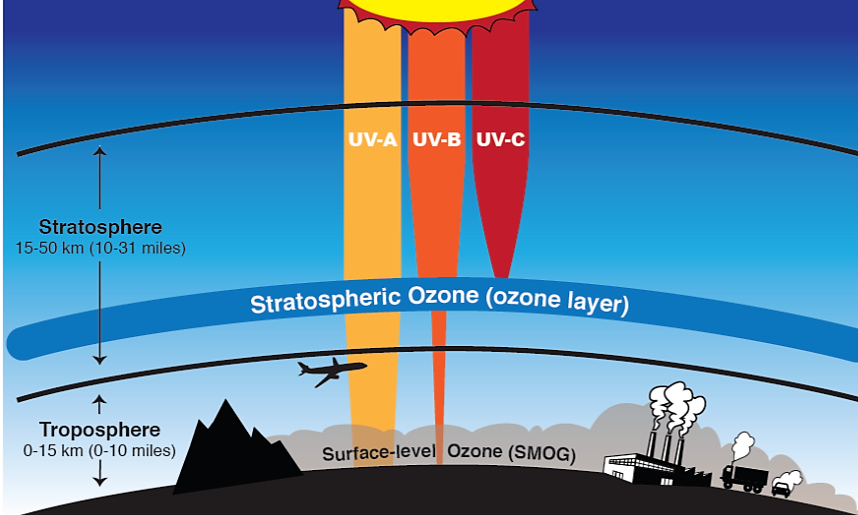
Ozone makes up a very small proportion of the gases in our atmosphere and most of it is concentrated in a portion of the stratosphere roughly 17–30 km above the surface. This region, called the ozone layer, acts as a protective shield that protects life on the surface of the Earth by absorbing most of the harmful portions of the high-energy UV radiation coming from the sun. UV is subdivided into three types namely UV-A, UV-B, and UV-C. Of these three types, UV-A is the least energetic and least harmful but can cause some damage to living cells, resulting in sunburns and skin damage. UV-A is also not absorbed by ozone in the stratosphere and is therefore transmitted through the atmosphere to the surface of the Earth. UV-C is the most harmful and most energetic of all UV, but is strongly absorbed in both the thermosphere and the stratosphere and does not make it to the Earth’s surface. UV-C is the one responsible for the splitting of oxygen molecules in the stratosphere that leads to the formation of ozone. When ozone absorbs UV it regenerates oxygen atoms and releases heat which warms the upper part of the stratosphere. Since UV-C does not make it to the Earth’s surface, the most harmful form of UV radiation that reaches the surface is UV-B. However, the amount of UV-B that reaches Earth’s surface is significantly reduced because most of it is absorbed by ozone in the stratosphere. Ozone is the only known gas that absorbs UV-B.
Natural conditions in the stratosphere sustain a dynamic balance between the creation and destruction of ozone which helps to ensure the continued existence of the ozone layer. Any disruption of this balance that results in a higher rate of ozone destruction than ozone creation would result in depletion of ozone. Ozone depletion, consequently, leads to significant increase in the amount of harmful UV-B radiation that reaches the Earth’s surface and this what we are talking about when we discuss the ozone problem.
.png?revision=1&size=bestfit&width=680&height=408)
Figure: Ozone is “good” in the stratosphere because it absorbs most ultraviolet radiation. Ozone is “bad” in the troposphere because it is harmful to breathe and is the primary component of smog in summer. Source: www.nasa.gov
The Ozone Hole
The Ozone Hole is not really a “hole” but rather an area where the thickness of the ozone layer is greatly reduced. This hole is a result of ozone depletion that occurs every year during the Antarctic spring and was first reported to the public by the British Antarctic Survey in 1985. The thickness of the ozone layer above the Antarctic continued to decline while the geographic area covered by the ozone hole continued to increase, reaching its lowest concentration (thickness) in 1994 and largest geographic area in 2000. Recent data shows that ozone concentration globally and in the Arctic and Antarctic is no longer declining.
During the long winter months of darkness over the Antarctic, atmospheric temperatures drop, creating unique conditions for chemical reactions that are not found anywhere else in the atmosphere. During this time, the Antarctic air mass is isolated from the rest of the atmosphere and circulates around the pole in what is known as the polar vortex. This isolation allows temperatures to drop low enough to create ice crystals at high altitudes. Ozone, nitric acid, sulfuric acid and other chlorine-containing molecules are absorbed on the surfaces of these ice particles. When the sun rises over the Antarctic in the southern spring (October), light rapidly releases free chlorine atoms into the stratosphere. The chlorine atoms react with ozone breaking it down to molecular oxygen and an oxygen atom. The polar vortex keeps the ozone-depleted air inside the vortex from mixing with the undepleted air outside the vortex, hence the formation of an ozone hole.
.png?revision=1&size=bestfit&width=720&height=311)
Figure: Ozone concentrations over the Antarctic region for four months representing the four seasons. Ozone concentration drops significantly during the Antarctic spring (October). Source: www.nasa.gov
Ozone Depletion
Global ozone concentrations change periodically with regular natural cycles such as changing seasons, winds, and long time scale sun variations. Concentrations of ozone in the atmosphere are measured in parts per billion (ppb). Scientists have been measuring ozone since the 1920’s using ground-based instruments that look skyward. Satellite measurements of concentrations of atmospheric ozone began in 1970 and continue today.
Ozone depletion occurs when the rate at which ozone is broken down is greater than the rate of its creation, interfering with the dynamic balance between creation and destruction that maintains the ozone layer. When this happens, the amount of harmful UV-B radiation that reaches the Earth’s surface increases. Ozone depletion was first identified over the Antarctic. Scientists suggested that reactions involving man-made chlorine-containing compounds were responsible for depleting ozone in the stratosphere. This hypothesis was based mostly on the physical and chemical properties of these compounds and knowledge about atmospheric conditions.
Chlorofluorocarbons (CFCs) are man-made compounds made up of chlorine, fluorine and carbon. These compounds were commonly used as propellants in everyday products such as shaving cream, hair spray, deodorants, paints and insecticides and as coolants in refrigerators and air conditioners. CFCs are extremely stable molecules and do not react with other chemicals in the lower atmosphere, part of the reason why they were considered a safe choice. Their stability means that they tend to remain in the atmosphere for a very long time. With the constant movement of air in the lower atmosphere, CFCs eventually make their way into the stratosphere. Exposure to ultraviolet radiation in the stratosphere breaks them apart, releasing chlorine atoms. Free chlorine (Cl) atoms then react with ozone molecules, taking one oxygen atom to form chlorine monoxide (ClO) and leaving an oxygen molecule (O2). The ClO reacts with other atoms freeing up the Cl making it available to react with another ozone molecule, repeating the cycle over and over resulting in ozone depletion.
.png?revision=1)
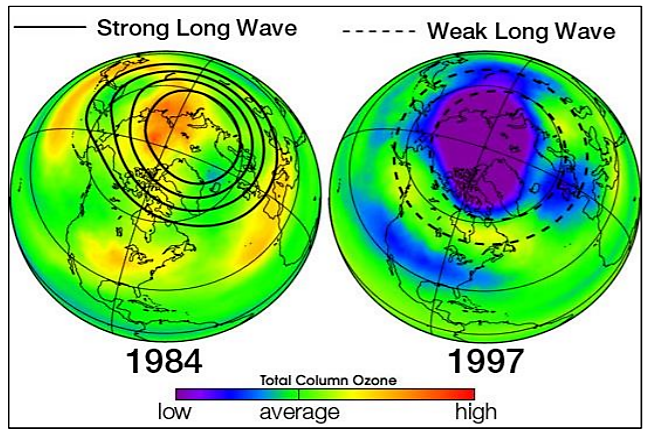
If each chlorine atom released from a CFC molecule destroyed only one ozone molecule, CFCs would pose very little threat to the ozone layer. However, when a chlorine monoxide molecule encounters a free atom of oxygen, the oxygen atom breaks up the chlorine monoxide, stealing the oxygen atom and releasing the chlorine atom back into the stratosphere to destroy another ozone molecule. These two reactions happen over and over again, so that a single atom of chlorine, acting as a catalyst, destroys many molecules (about 100,000) of ozone. The consequence of stratospheric ozone depletion is increased levels of UV-B radiation reaching the Earth’s surface, posing a threat to human health and the environment. The figure below shows a lower than average amount of stratospheric ozone over North America in 1997 when it was abnormally cold compared to 1984, which was warmer than average, showing that ozone depletion does not exclusively affect just the South Pole (Antarctic).
.png?revision=1&size=bestfit&width=519&height=346)
The Montreal Protocol
International policy efforts to restrict production of ozone depleting CFCs culminated in the 1987 treaty known as the Montreal Protocol in which signing nations agreed to cut CFC production in half by 1998. At least five follow-up agreements since then helped to deepen the cuts, advanced timetables for compliance, and addressed additional ozone-depleting substances such as halons, methyl chloroform, carbon tetrachloride, and hydrochlorofluorocarbons (HCFCs). Most countries around the world have phased out production of the substances covered by the agreements and industry has been able to shift to safer alternative chemicals. As a result, there’s evidence that the Antarctic ozone hole has stopped growing worse, although recovery is not expected anytime soon. Phasing out CFCs and HCFCs is also beneficial in protecting the earth’s climate, as these substances are also very damaging greenhouse gases.
As part of the United States’ commitment to implementing the Montreal Protocol, the U.S. Congress amended the Clean Air Act, adding provisions for protection of the ozone layer. Most importantly, the amended Act required the gradual end to the production of chemicals that deplete the ozone layer. The Clean Air Act amendments passed by Congress requires the Environmental Protection Agency (EPA) to develop and implement regulations for the responsible management of ozone-depleting substances in the United States. Under the Clean Air Act, EPA has created several regulatory programs to address numerous issues, including:
- ending the production of ozone-depleting substances,
- ensuring that refrigerants and halon fire extinguishing agents are recycled properly,
- identifying safe and effective alternatives to ozone-depleting substances,
- banning the release of ozone-depleting refrigerants during the service, maintenance, and disposal of air conditioners and other refrigeration equipment,
- requiring that manufacturers label products either containing or made with the most harmful ozone depleting substances.
Whatever happened to the hole in the ozone layer? – Stephanie Honchell Smith
In the 1980s, the world faced a huge problem: there was a rapidly expanding hole in the ozone layer. If it continued to grow, rates of skin cancer could skyrocket, photosynthesis would be impaired, agricultural production would plummet, and entire ecosystems would collapse. So, what happened? Stephanie Honchell Smith shares how decisive global cooperation helped restore the ozone layer.
Outdoor Air Pollution
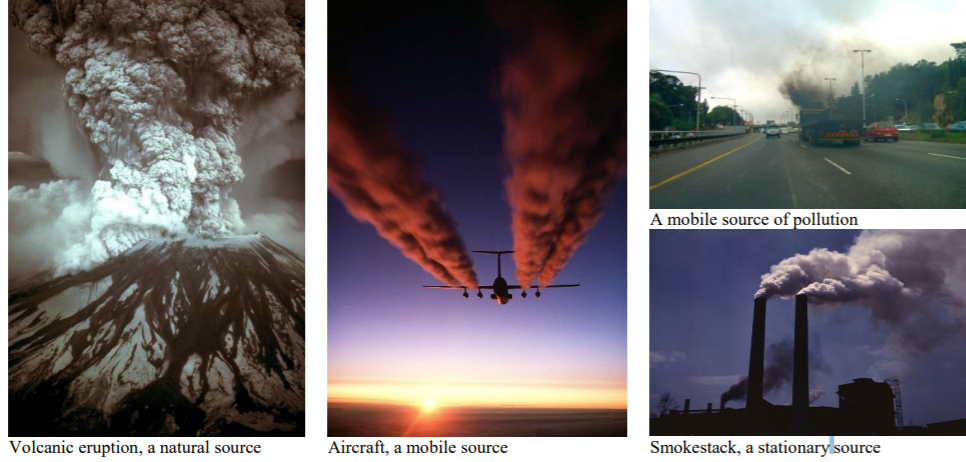
Air pollution refers to the introduction, into the atmosphere, of substances that have harmful effects on humans, other living organisms, and the environment either as solid particles, liquid droplets or gases. Air pollution can result from natural processes such as dust storms, forest fires, and volcanic eruptions, or from human activities such as biomass burning, vehicular emissions, mining, agriculture, and industrial processes. Improved technology and government policies have helped reduce most types of outdoor air pollution in many industrialized countries including the United States, in recent decades. However, outdoor air quality is still a problem in less industrialized nations, especially in megacities of rapidly industrializing nations such as China and India.
Outdoor pollutants can come from stationary (point) sources or mobile (nonpoint) sources. Stationary sources have a fixed location, for example power plant smokestacks, burning, construction sites, farmlands and surface mines among others. Mobile sources of air pollutants move from place to place while emitting pollutants. Examples of mobile sources include vehicles, aircrafts, ships, and trains.
.png?revision=1&size=bestfit&width=777&height=372)
Pollutants are categorized into two major types based on how they originated namely primary and secondary pollutants. Primary pollutants are those released directly from the source into the air in a harmful form. The primary pollutants that account for nearly all air pollution problems are carbon monoxide (58%), volatile organic compounds (VOCs, 11%), nitrogen oxides (15%), sulfur dioxides (13%), and particulate material (3%). Secondary pollutants are produced through reactions between primary pollutants and normal atmospheric compounds. For example, ground-level ozone forms over urban areas through reactions, powered by sunlight, between primary pollutants (oxides of nitrogen) and other atmospheric gases such as VOCs.
The majority of air pollutants can be traced to the burning of fossil fuels. We burn fuels in power plants to generate electricity, in factories to power machinery, in stoves and furnaces for heat, in airplanes, ships, trains, and motor vehicles for transportation, and in waste facilities to incinerate waste. Since long before fossil fuels powered the Industrial Revolution, we have burned wood for heat, fireplaces, and campfires and vegetation for agriculture and land management. The resulting primary and secondary pollutants and the problems to which they contribute are included in Table below.
| Pollutant | Example/Major Source | Problem |
| Sulfur oxides (SOx) | Coal-fired power plants | Acid Rain |
| Nitrogen oxides (NOx) | Motor vehicle exhaust | Acid Rain |
| Carbon monoxide (CO) | Motor vehicle exhaust | Poisoning |
| Carbon dioxide (CO2) | All fossil fuel burning | Global Warming |
| Particulate matter (smoke, dust) | Wood and coal burning | Respiratory disease, Global Dimming |
| Mercury | Coal-fired power plants, medical waste | Neurotoxicity |
| Smog | Coal burning | Respiratory problems; eye irritation |
| Ground-level ozone | Motor vehicle exhaust | Respiratory problems; eye irritation |
Beyond the burning of fossil fuels, other anthropogenic (human-caused) sources of air pollution are shown in Table below.
| Activity | Pollutant | Problem |
|
|
|
|
VOCs, POPs CFCs | Cancer, Global Warming Ozone Depletion |
| Nuclear power and defense | Radioactive waste | Cancer |
| Landfills | Methane (CH4) | Global Warming |
| Mining | Asbestos | Respiratory problems |
| Biological Warfare | Microorganisms | Infectious Disease |
| Indoor Living | CO, VOCs, asbestos, dust, mites, molds, particulates | Indoor air pollution |
- DDT = an organic pesticide; PCB = poly-chlorinated biphenyls, used as coolants and insulators; DDT and most PCBs are now banned at least in the U.S., but persist in the environment; PAHs = polycyclic aromatic hydrocarbons – products of burning fossil fuels, many linked to health problems

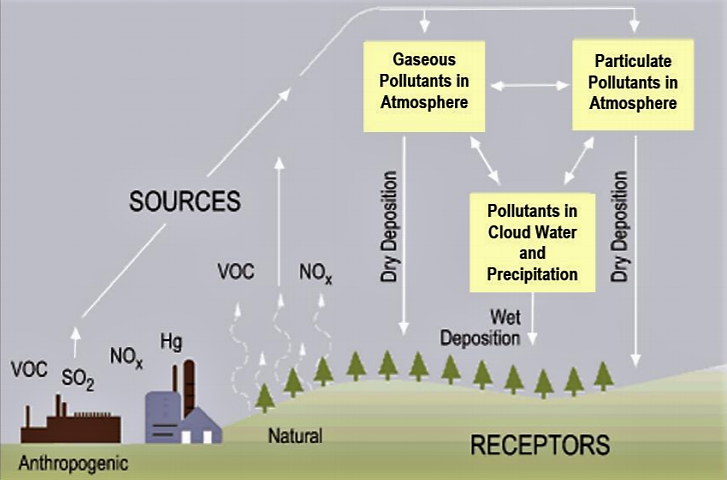
Many processes contribute to atmospheric pollution and trace gases. Click on image for a zoom. From US Strategic Plan for the Climate Change Science Program, Final Report July 2003: Chapter 3 Atmospheric Composition.

Criteria pollutants
Under the Clean Air Act (section 6.7.1), the Environmental Protection Agency (EPA) establishes air quality standards to protect public health and the environment. EPA has set national air quality standards for six common air pollutants namely: 1) carbon monoxide; 2) ground-level ozone; 3) nitrogen dioxide; 4) Sulfur dioxide; 5) lead; and 6) particulate matter (also known as particle pollution). Of the six pollutants, particle pollution and ground-level ozone are the most widespread health threats. EPA calls these pollutants “criteria” air pollutants because it regulates them by developing human health-based and/or environmentally-based criteria (science-based guidelines) for setting permissible levels. The set of limits based on human health is called primary standards. Another set of limits intended to prevent environmental and property damage is called secondary standards.
- Carbon Monoxide (CO): is a colorless, odorless gas emitted from combustion processes, specifically, the incomplete combustion of fuel. Nationally and, particularly in urban areas, the majority of CO emissions to ambient air come from mobile sources. CO can cause harmful health effects by reducing oxygen delivery to the body’s organs (like the heart and brain) and tissues. At extremely high levels, CO can cause death.
- Ground-level ozone (O3): is a colorless gas with a slightly sweet odor that is not emitted directly into the air, but is created by the interaction of sunlight, heat, oxides of nitrogen (NOx) and volatile organic compounds (VOCs). Ozone is likely to reach unhealthy levels on hot sunny days in urban environments. Emissions from industrial facilities and electric utilities, motor vehicle exhaust, gasoline vapors, and chemical solvents are some of the major sources of NOx and VOCs.
- Nitrogen dioxide (NO2): is one of a group of highly reactive gasses known as “oxides of nitrogen,” or “nitrogen oxides (NOx).” Other nitrogen oxides include nitrous acid and nitric acid. NO2 is a yellowish-brown to reddish-brown foul-smelling gas that is a major contributor to smog and acid rain. Nitrogen oxides result when atmospheric nitrogen and oxygen react at the high temperatures created by combustion engines. Most emissions in the U.S. result from combustion in vehicle engines, electrical utility, and industrial combustion.
- Sulfur dioxide (SO2): Sulfur dioxide is one of a group of highly reactive gasses known as “oxides of sulfur.” The largest sources of SO2 emissions are from fossil fuel combustion at power plants (73%) and other industrial facilities (20%). Smaller sources of SO2 emissions include industrial processes such as extracting metals from their ores, and the burning of high sulfur containing fuels by locomotives, large ships, and non-road equipment.
- Lead (Pb): is a metal found naturally in the environment as well as in manufactured products. The major sources of lead emissions have historically been from fuels in motor vehicles (such as cars and trucks) and industrial sources. As a result of EPA’s regulatory efforts to remove lead from gasoline, emissions of lead from the transportation sector dramatically declined by 95 percent between 1980 and 1999, and levels of lead in the air decreased by 94 percent during that time period. The major sources of lead emissions today are ore and metal processing and piston-engine aircraft operating on leaded aviation gasoline. Today, the highest levels of lead in air are usually found near lead smelters.
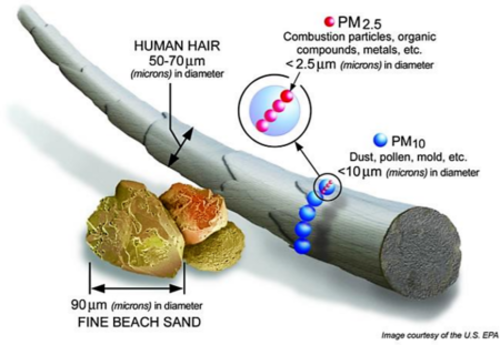
- Particulate material (PM), sometimes known simply as “particulates” refers to solid particles and liquid droplets suspended in the air we breathe. Particulate pollution is made up of a variety of components, including acids (nitrates and sulfates), organic chemicals, metals, soil or dust particles, and allergens (pollen and mold spores). The size of the particles in directly linked to their potential for causing health problems. Particles that are 10 micrometers in diameter or smaller generally pass through the throat and nose and enter the lungs. EPA groups these into two types: “inhalable coarse particles,” with diameters larger than 2.5 micrometers and smaller than 10 micrometers and “fine particles,” with diameters that are 2.5 micrometers and smaller. How small is 2.5 micrometers? Think about a single hair from your head. The average human hair is about 70 micrometers in diameter – making it 30 times larger than the largest fine particle.Our respiratory systems are equipped to filter larger particles out of the air once it is inhaled. However, the lungs are vulnerable to both coarse particles (PM10), and fine particles (PM2.5). These can slip past the respiratory system’s natural defenses and get deep into the lungs and some may even get into the bloodstream. Coarse particles come from road dust while fine particles come from combustion processes.
Volatile Organic Compounds
Volatile organic compounds (VOCs) are carbon-containing chemicals emitted as gases from natural and human-made sources. Natural sources of VOCs include plants, the largest source, and bacteria in the guts of termites and ruminant animals. These compounds are generally oxidized to carbon monoxide and carbon dioxide in the atmosphere. VOCs are of great concern because they are precursors for the formation of ozone, a secondary air pollutant.
A large number of synthetic organic chemicals such as benzene, toluene, formaldehyde, vinyl chloride, chloroform, and phenols are widely used as ingredients in countless household products. Paints, paint strippers, varnishes, many cleaning, disinfecting, cosmetic, degreasing, and hobby products all contain VOCs. Fuels are also made up of organic chemicals. All of these products can release organic compounds while you are using them, and, to some degree, when they are stored. The “new car smell” characteristic of new cars is from a complex mix of dozens of VOC. Also, concentrations of many VOCs are consistently higher indoors (up to ten times higher) than outdoors. They are often held responsible for sick building syndrome, an illness resulting from indoor pollution in which the specific cause is not identified.
Smog
Smog is a mixture of air pollutants (sulfur dioxide, nitrogen oxides, ozone, and particulates) that often form over urban areas as a result of fossil fuel combustion. The term was coined from the terms “smoke” and “fog” referring to a brownish haze that pollutes the air, greatly reducing visibility and making it difficult for some people to breathe. There are two main types of smog: industrial and photochemical smog. Industrial smog is produced primarily by the burning of fossil fuels which produces carbon dioxide (from complete combustion), carbon monoxides (from partial combustion), sulfur, and mercury. The sulfur reacts with other chemicals in the atmosphere producing several sulfur compounds including sulfur dioxide. These compounds along with particulate material make up industrial smog. Photochemical smog is formed when sunlight drives chemical reactions between primary pollutants from automobiles and normal atmospheric compounds. The product is a mix of over 100 different chemicals with the most abundant being ground-level ozone.
.png?revision=1&size=bestfit&width=486&height=317)
.png?revision=1)
Toxic pollutants
Toxic air pollutants, also known as hazardous air pollutants, are those pollutants that are known or suspected to cause cancer or other serious health effects, such as reproductive effects or birth defects, or adverse environmental effects. Examples of toxic air pollutants include benzene, which is found in gasoline; perchloroethylene, which is emitted from some dry cleaning facilities; methylene chloride, which is used as a solvent and paint stripper by a number of industries; and others such as dioxin, asbestos, toluene, and metals such as cadmium, mercury, chromium, and lead compounds.
Most air toxics originate from human-made sources, including mobile sources (e.g., cars, trucks, buses) and stationary sources (e.g., factories, refineries, power plants), as well as indoor sources (e.g., some building materials and cleaning solvents). Some air toxics are also released from natural sources such as volcanic eruptions and forest fires. Exposure to air toxics is mainly through breathing but some toxic air pollutants such as mercury can deposit onto soils or surface waters, where they are taken up by plants and ingested by animals and are eventually magnified up through the food chain. Like humans, animals may experience health problems if exposed to sufficiently high quantities of air toxics over time.
Light Pollution
One additional topic relates to atmospheric change. Light pollution (Figure below) results from humans’ production of light in amounts which are annoying, wasteful, or harmful. Light is essential for safety and culture in industrial societies, but reduction in wasteful excess could mitigate its own harmful effects, as well as the amounts of fossil fuel used to generate it. Astronomers – both amateur and professional – find light interferes with their observations of the night skies. Some studies show that artificial spectra and excessive light exposure has harmful effects on human health. Life evolved in response to natural cycles and natural spectra of light and dark, so it is not surprising that our changes in both of those might affect us and other forms of life. Light pollution can affect animal navigation and migration and predator/prey interactions. Because many birds migrate by night, Toronto, Canada has initiated a program to turn out lights at night during spring and fall migration seasons. Light may interfere with sea turtle egg-laying and hatching, because both happen on coasts at nighttime. The behavior of nocturnal animals from owls to moths can be changed by light, and night-blooming flowers can be affected directly or through disruption of pollination. Zooplankton normally show daily vertical migration, and some data suggests that changes in this behavior can lead to algal blooms.

When light produced by humans becomes annoying, wasteful, or harmful, it is considered light pollution. This composite satellite image of Earth at night shows that light is concentrated in urban
Solutions to problems caused by light pollution include
- reducing use
- changing fixtures to direct light more efficiently and less harmfully
- changing the spectra of light released
- changing patterns of lighting to increase efficiency and reduce harmful effects
Many cities, especially those near observatories, are switching to low-pressure sodium lamps, because their light is relatively easy to filter.
Indoor Air Pollutants
In both developed and developing nations, indoor air pollution poses a greater health risk than outdoor air pollution. According to the World Health Organization (WHO) and other agencies such as the Environmental Protection Agency (EPA), indoor air generally contains higher concentrations of toxic pollutants than outdoor air. Additionally, people generally spend more time indoors than outdoors, hence, the health effects from indoor air pollution in workplaces, schools, and homes are far greater than outdoor. Indoor pollution sources that release gases or particles into the air are the primary cause of indoor air quality problems in homes. Inadequate ventilation can increase indoor pollutant levels by not bringing in enough outdoor air to dilute emissions from indoor sources and by not carrying indoor air pollutants out of the home.
Outdoor air enters and leaves a building by infiltration, natural ventilation, and mechanical ventilation. In infiltration, outdoor air flows into the house through openings, joints, and cracks in walls, floors, and ceilings, and around windows and doors. In natural ventilation, air moves through opened windows and doors. Air movement associated with infiltration and natural ventilation is caused by air temperature differences between indoors and outdoors and by wind. Finally, there are a number of mechanical ventilation devices, from outdoor-vented fans that intermittently remove air from a single room, such as bathrooms and kitchen, to air handling systems that use fans and duct work to continuously remove indoor air and distribute filtered and conditioned outdoor air to strategic points throughout the house. The rate at which outdoor air replaces indoor air is described as the air exchange rate. When there is little infiltration, natural ventilation, or mechanical ventilation, the air exchange rate is low and pollutant levels can increase. High temperature and humidity levels can also increase concentrations of some pollutants.
There are many sources of indoor air pollution in any home. These include combustion sources such as oil, gas, kerosene, coal, wood, and tobacco products; building materials and furnishings as diverse as deteriorated, asbestos-containing insulation, wet or damp carpet, and cabinetry or furniture made of certain pressed wood products; products for household cleaning and maintenance, personal care, or hobbies; central heating and cooling systems and humidification devices. Pollutants causing indoor air pollution can also originate from outside sources such as radon, pesticides, and outdoor air pollution. Radon is a naturally occurring radioactive gas produced from the decay of uranium in rock. If a building/home is constructed in an area with uranium containing rock, the gas can seep through the foundations and accumulate in basements. Exposure to radon can cause lung cancer.
The relative importance of any single source depends on how much of a given pollutant it emits and how hazardous those emissions are. In some cases, factors such as how old the source is and whether it is properly maintained are significant. For example, an improperly adjusted gas stove can emit significantly more carbon monoxide than one that is properly adjusted. Some sources, such as building materials, furnishings, and household products like air fresheners, release pollutants more or less continuously. Other sources, related to activities carried out in the home, release pollutants intermittently. These include smoking, the use of unvented or malfunctioning stoves, furnaces, or space heaters, the use of solvents in cleaning and hobby activities, the use of paint strippers in redecorating activities, and the use of cleaning products and pesticides in house-keeping. High pollutant concentrations can remain in the air for long periods after some of these activities.
Risks from indoor air pollution differ between less industrialized and industrialized nations. Indoor pollution has a greater impact in less industrialized nations where many people use cheaper sources of fuel such as wood, charcoal, and crop waste among others for cooking and heating, often with little or no ventilation. The most significant indoor pollutant, therefore, is soot and carbon monoxide. In industrialized nations, the primary indoor air health risks are cigarette smoke and radon.
.png?revision=1) Figure: Sources of indoor air pollution. Image source: EPA http://www.epa.gov/iaq/pdfs/careforyourair.pdf
Figure: Sources of indoor air pollution. Image source: EPA http://www.epa.gov/iaq/pdfs/careforyourair.pdf
Effects of Air Pollution on Human Health
The World Health Organization (WHO) and other international agencies recognize air pollution as a major threat to human health. Numerous scientific studies have linked air pollution to a variety of health problems including: aggravation of respiratory and cardiovascular diseases; decreased lung function; increased frequency and severity of respiratory symptoms such as difficulty breathing and coughing; increased susceptibility to respiratory infections; effects on the nervous system, including the brain, such as IQ loss and impacts on learning, memory, and behavior; cancer; and premature death. Immediate effects of air pollution may show up after a single exposure or repeated exposures. Other health effects may show up either years after exposure has occurred or only after long or repeated periods of exposure.
Immediate effects of air pollution include irritation of the eyes, nose, and throat, headaches, dizziness, and fatigue. Such immediate effects are usually short-term and treatable. Sometimes the treatment is simply eliminating the person’s exposure to the source of the pollution, if it can be identified. Symptoms of some diseases, including asthma, hypersensitivity pneumonitis, and humidifier fever , may also show up soon after exposure to some indoor air pollutants.
| Pollutant | Sources | Health Effects |
| Ground-level Ozone (O3) | Secondary pollutant typically formed by chemical reaction of volatile organic compounds (VOCs) and NOx in the presence of sunlight. | Decreases lung function and causes respiratory symptoms, such as coughing and shortness of breath; aggravates asthma and other lung diseases leading to increased medication use, hospital admissions, emergency department (ED) visits, and premature mortality. |
| Particulate Matter (PM) | Emitted or formed through chemical reactions; fuel combustion (e.g., burning coal, wood, diesel); industrial processes; agriculture (plowing, field burning); and unpaved roads. | Short-term exposures can aggravate heart or lung diseases leading to respiratory symptoms, increased medication use, hospital admissions, ED visits, and premature mortality; long-term exposures can lead to the development of heart or lung disease and premature mortality. |
| Lead | Smelters (metal refineries) and other metal industries; combustion of leaded gasoline in piston engine aircraft; waste incinerators; and battery manufacturing. | Damages the developing nervous system, resulting in IQ loss and impacts on learning, memory, and behavior in children. Cardiovascular and renal effects in adults and early effects related to anemia. |
| Oxides of Nitrogen (NOx) | Fuel combustion (e.g., electric utilities, industrial boilers, and vehicles) and wood burning. | Aggravate lung diseases leading to respiratory symptoms, hospital admissions, and ED visits; increased susceptibility to respiratory infection. |
| Carbon Monoxide (CO) | Fuel combustion (especially vehicles), industrial processes, fires, waste combustion, and residential wood burning. | Reduces the amount of oxygen reaching the body’s organs and tissues; aggravates heart disease, resulting in chest pain and other symptoms leading to hospital admissions and ED visits. |
| Sulfur Dioxide (SO2) | Fuel combustion (especially high-sulfur coal); electric utilities and industrial processes; and natural sources such as volcanoes. | Aggravates asthma and increased respiratory symptoms. Contributes to particle formation with associated health effects. |
Source: www.epa.gov
The likelihood of immediate reactions to air pollutants depends on several factors. Age and preexisting medical conditions are two important influences. Some sensitive individuals appear to be at greater risk for air pollution-related health effects, for example, those with pre-existing heart and lung diseases (e.g., heart failure/ischemic heart disease, asthma, emphysema, and chronic bronchitis), diabetics, older adults, and children. In other cases, whether a person reacts to a pollutant depends on individual sensitivity, which varies tremendously from person to person. Some people can become sensitized to biological pollutants after repeated exposures, and it appears that some people can become sensitized to chemical pollutants as well.
Acid Rain
Pure rainfall is slightly acidic, pH 5.6, because water reacts with atmospheric carbon dioxide to produce weak carbonic acid. When higher than normal amounts of nitric and sulfuric acid occur in the atmosphere, the result is precipitation with a pH below 5.6 which is referred to as acid rain. Acid rain includes both wet deposition (rainfall, snow, fog) and dry deposition (particulates). Acid rain formation results from both natural sources, such as volcanoes and decaying vegetation, and man-made sources, primarily emissions of sulfur dioxide (SO2) and nitrogen oxides (NOx) resulting from fossil fuel combustion. In the United States, roughly 2/3 of all SO2 and ¼ of all NOx come from electric power generation that relies on burning fossil fuels, like coal. Acid rain occurs when these gases react in the atmosphere with water, oxygen, and other chemicals to form various acidic compounds. The result is a mild solution of sulfuric acid and nitric acid. When sulfur dioxide and nitrogen oxides are released from power plants and other sources, prevailing winds blow these compounds across state and national borders, sometimes over hundreds of miles. Regions of greatest acidification tend to be downwind from heavily industrialized source areas of pollution.
.png?revision=1&size=bestfit&width=623&height=411)
- Acid rain is a serious environmental problem that is particularly damaging to lakes, streams, and forests and the plants and animals that live in these ecosystems, as well as to infrastructure. Some of the impacts include:
- Leaching of soil nutrients such as calcium, magnesium, and potassium out of the topsoil, altering soil chemistry and harming plants and soil organisms.
- Acid rain causes the release of substances that are toxic to trees and other plants, such as aluminum, into the soil. Scientists hypothesize that this combination of loss of soil nutrients and increase of toxic aluminum may be one way that acid rain harms trees. Such substances also wash away in the runoff and are carried into streams, rivers, and lakes.
- Damage to automotive paints and other coatings. The reported damage typically occurs on horizontal surfaces and appears as irregularly shaped, permanently etched areas.
- Acidic particles contribute to the corrosion of metals (such as bronze) and the deterioration of paint and stone (such as marble and limestone). These effects significantly reduce the societal value of buildings, bridges, cultural objects (such as statues, monuments, and tombstones).
- Sulfates and nitrates that form in the atmosphere contribute to visibility impairment, meaning we cannot see as far or as clearly through the air. Sulfate particles account for 50 to 70 percent of the visibility reduction in the eastern part of the U.S., affecting our enjoyment of national parks, such as the Shenandoah and the Great Smoky Mountains
.png?revision=1)
.png?revision=1)
Figure: Effects of acid rain on a monument in Greenwood cemetery, Brooklyn New York. Photo by James P. Fischer. commons.wikimedia.org/wiki/C…rain#/media/File:Charlotte_Canda_Memorial_(Angel).jpg
Air Pollution Legislation
In 1930, 63 people died and 1000 were sickened in Belgium when a phenomenon referred to as temperature inversion caused pollutants to be trapped near the surface, leading to a sudden spike in atmospheric sulfur levels. In October 1948, a thick cloud of air pollution formed above the industrial town of Donora, Pennsylvania. The cloud which lingered for five days, killed 20 people and caused sickness in 6,000 of the town’s 14,000 people. In 1952, the infamous London fog in which acid aerosols trapped in the lower atmosphere killed 4000 people. Events like these alerted us to the dangers that air pollution poses to public health.
Clean Air Act
In the United States, several federal and state laws were passed, including the original Clean Air Act of 1963, which established funding for the study and cleanup of air pollution. But there was no comprehensive federal response to address air pollution until Congress passed a much stronger Clean Air Act in 1970. That same year Congress created the Environmental Protection Agency (EPA) and gave it the primary role in carrying out the law. Since 1970, EPA has been responsible for a variety of Clean Air Act programs to reduce air pollution nationwide. The Clean Air Act is a federal law covering the entire country. However, states, tribes and local governments do a lot of the work to meet the Act’s requirements. For example, representatives from these agencies work with companies to reduce air pollution. They also review and approve permit applications for industries or chemical processes.
The Plain English Guide to the Clean Air Act
EPA’s Role
EPA’s mission is basic health and environmental protection from air pollution for all Americans. To achieve this mission, EPA implements a variety of programs under the Clean Air Act that focus on:
- reducing outdoor, or ambient, concentrations of air pollutants that cause smog, haze, acid rain, and other problems;
- reducing emissions of toxic air pollutants that are known to, or are suspected of, causing cancer or other serious health effects; and
- phasing out production and use of chemicals that destroy stratospheric ozone.
Under the Clean Air Act, EPA sets limits on certain air pollutants, including setting limits on how much can be in the air anywhere in the United States. The Clean Air Act also gives EPA the authority to limit emissions of air pollutants coming from sources like chemical plants, utilities, and steel mills. Individual states or tribes may have stronger air pollution laws, but they may not have weaker pollution limits than those set by EPA. EPA must approve state, tribal, and local agency plans for reducing air pollution. If a plan does not meet the necessary requirements, EPA can issue sanctions against the state and, if necessary, take over enforcing the Clean Air Act in that area. EPA assists state, tribal, and local agencies by providing research, expert studies, engineering designs, and funding to support clean air progress. Since 1970, Congress and the EPA have provided several billion dollars to the states, local agencies, and tribal nations to accomplish this.
State and Local Governments’ Role
It makes sense for state and local air pollution agencies to take the lead in carrying out the Clean Air Act. They are able to develop solutions for pollution problems that require special understanding of local industries, geography, housing, and travel patterns, as well as other factors. State, local, and tribal governments also monitor air quality, inspect facilities under their jurisdictions and enforce Clean Air Act regulations. States have to develop State Implementation Plans (SIPs) that outline how each state will control air pollution under the Clean Air Act. A SIP is a collection of the regulations, programs and policies that a state will use to clean up polluted areas. The states must involve the public and industries through hearings and opportunities to comment on the development of each state plan.
Outcomes of the Clean Air Act
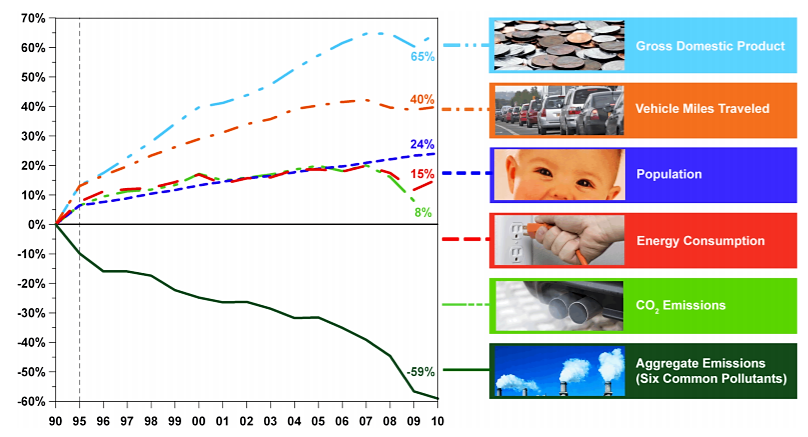
For more than forty years, the Clean Air Act has cut pollution as the U.S. economy has grown. The combined emissions of the six criteria pollutants has continued to decrease while population, gross domestic product, energy consumption, and vehicle miles travelled have all continued to increase. The following is a summary of some of the accomplishments of the Clean Air Act:
- Clean Air Act programs have lowered levels of the six criteria pollutants – particulates, ozone, lead, carbon monoxide, nitrogen dioxide and sulfur dioxide – as well as numerous toxic pollutants.
.png?revision=1&size=bestfit&width=683&height=369)
- From 1970 to 2012, aggregate national emissions of the six common pollutants alone dropped an average of 72 percent while gross domestic product grew by 219 percent (Figure 6.7.1). This progress reflects efforts by state, local and tribal governments; EPA; private sector companies; environmental groups and others.
- The emissions reductions have led to dramatic improvements in the quality of the air that we breathe.
- These air quality improvements have enabled many areas of the country to meet national air quality standards set to protect public health and the environment. For example, all of the 41 areas that had unhealthy levels of carbon monoxide in 1991 now have levels that meet the health based national air quality standard. A key reason is that the motor vehicle fleet is much cleaner because of Clean Air Act emissions standards for new motor vehicles.
- Airborne lead pollution, a widespread health concern before EPA phased out lead in motor vehicle gasoline under Clean Air Act authority, now meets national air quality standards in most areas of the country.
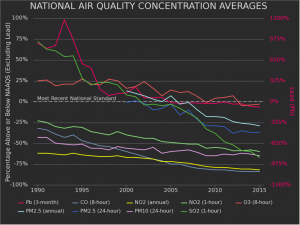
Figure: Atmospheric concentrations of lead (Pb), carbon monoxide (CO), nitrous oxide (NO2), ozone (O3), particulate matter (PM2.5 and PM10), and sulfur dioxide (SO2) have all decreased in the United States since the Clean Air Act was amended in 1990.
Monitoring air quality is the best way to tell if the air is getting cleaner, because the monitors accurately report how much of a pollutant is in the air. You can request EPA, state, local, or tribal monitoring reports that show changes over time. It is updated frequently, so you can get recent information on what’s happening to the air in your community. Visit www.epa.gov/airtrends for more information.
The “Air Quality Index” (AQI) is a “public-friendly” way of using actual monitoring data to help us assess how clean our air is. Americans are familiar with many radio, TV, and newspaper weather forecasters talking about the AQI— telling you that the air is so polluted that a “Code Orange” or “Code Red” air quality condition is in effect. Information on the AQI can be found at: www.airnow.gov. The National Air Toxics Assessment is an on-going,
comprehensive evaluation of air toxics in the United States. Visit www.epa.gov/ttn/atw for air toxics information on emissions, risk, and exposure in
your area.
Clean Air Interstate Rule (CAIR)
Air pollution can travel hundreds of miles and cause multiple health and environmental problems on regional or national scales. EPA’s Clean Air Interstate Rule (CAIR) addressed regional interstate transport of soot (fine particulate matter) and smog (ozone), which are associated with thousands of premature deaths and illnesses each year. CAIR required 28 eastern states to make reductions in sulfur dioxide (SO2) and nitrogen oxides (NOX) emissions that contribute to unhealthy levels of fine particle and ozone pollution in downwind states. CAIR was replaced by the Cross-State Air Pollution Rule, as of January 1, 2015.
Under CAIR, States must achieve the required emission reductions using one of two compliance options:
- Meet the state’s CAIR requirements by requiring power plants to participate in an EPA-administered interstate cap and trade system that caps emissions in two stages, or
- Meet an individual state emissions budget through measures of the state’s choosing.
All affected states chose to meet their emission reduction requirements by controlling power plant emissions through three separate interstate cap and trade programs: the CAIR SO2 annual trading program, the CAIR NOX annual trading program, and the CAIR NOX ozone season trading program.
By the year 2015, the Clean Air Interstate Rule will result in:
- $85 to $100 billion in annual health benefits, annually preventing 17,000 premature deaths, millions of lost work and school days, and tens of thousands of non-fatal heart attacks and hospital admissions.
- Nearly $2 billion in annual visibility benefits in southeastern national parks, such as Great Smoky and Shenandoah.
- Significant regional reductions in sulfur and nitrogen deposition, reducing the number of acidic lakes and streams in the eastern U.S.
Charts and Tables – A collection of printable charts, tables, and graphics demonstrating the health and environmental benefits of CAIR.
Preventing Air Pollution
Ways to maintain our atmosphere and its ecosystem services:
- Reducing use of fossil fuels
- Switching to cleaner fuels
- Switching to renewable energy sources
- Increasing fuel efficiencies
- Supporting legislation for fuel efficiencies
- Supporting national and international agreements to limit emissions
- Utilizing pollution control technologies: e.g., scrubbers on smokestacks and catalytic converters for motor vehicles
- Creating and supporting urban planning strategies
As always, costs are high and tradeoffs must be considered. The classic example is nuclear power, whose effects on the atmosphere are less than those of fossil fuels. Unfortunately, it has high potential for health damage and high costs – both economic and environmental – for storage and transport of nuclear waste.
Attributes
This chapter is composed of text taken from the following sources:
Air PollutionLinks to an external site. is shared under a CC BY-NC-SA 4.0Links to an external site. license and was authored, remixed, and/or curated by Caralyn Zehnder, Kalina Manoylov, Samuel Mutiti, Christine Mutiti, Allison VandeVoort, & Donna BennettLinks to an external site. (GALILEO Open Learning MaterialsLinks to an external site.) via source contentLinks to an external site. that was edited to the style and standards of the LibreTexts platform.
Introduction to Environmental Science CK-12 licensed under CK-12. Created by: Michelle R. © CK-12 Foundation 2023. https://www.ck12.org/user:bwvzdgfibguzn2vkdubnbwfpbc5jb20./book/introduction-to-environmental-science/
EPA Clean Air Interstate Rule (CAIR). https://archive.epa.gov/airmarkets/programs/cair/web/html/index.htmlLinks to an external site. https://wwwLinks to an external site..epa.gov/sites/default/files/2015-08/documents/cair09_ecm_analyses.pdf
Figure: Atmospheric concentrations of lead (Pb), carbon monoxide (CO), nitrous oxide (NO2), ozone (O3), particulate matter (PM2.5 and PM10), and sulfur dioxide (SO2) have all decreased in the United States since the Clean Air Act was amended in 1990. Copyright © by Sean Whitcomb is licensed under a Creative Commons Attribution 4.0 International License, except where otherwise noted. Modifications to this photo include cropping.
Whatever happened to the hole in the ozone layer? Video by Stephanie Honchell Smith. https://www.youtube.com/watch?v=5wVJeq4mLL0Links to an external site.
Summary of the Clean Air Act 42 U.S.C. §7401 et seq. (1970). https://www.epa.gov/laws-regulations/summary-clean-air-act
