9 Climate Change: Are you part of the Problem or part of the Solution?
Learning Objectives:
- What is climate change and how it is defined
- Understand the history behind climate change
- Describe the causes and consequences of climate change both regional and global
- what are the major greenhouse gases(GHGs) and identify their sources and impacts
- how is climate change effecting ecosystem and biodiversity
- Be able to evaluate the impacts from various viewpoints and diverse groups
- Identify procedures of climate remediation and how to sequestrate carbon
- What tools are scientists using to study climate change
The world’s top 1% of emitters produce over 1000 times more CO2 than the bottom 1% with the US leading the way!
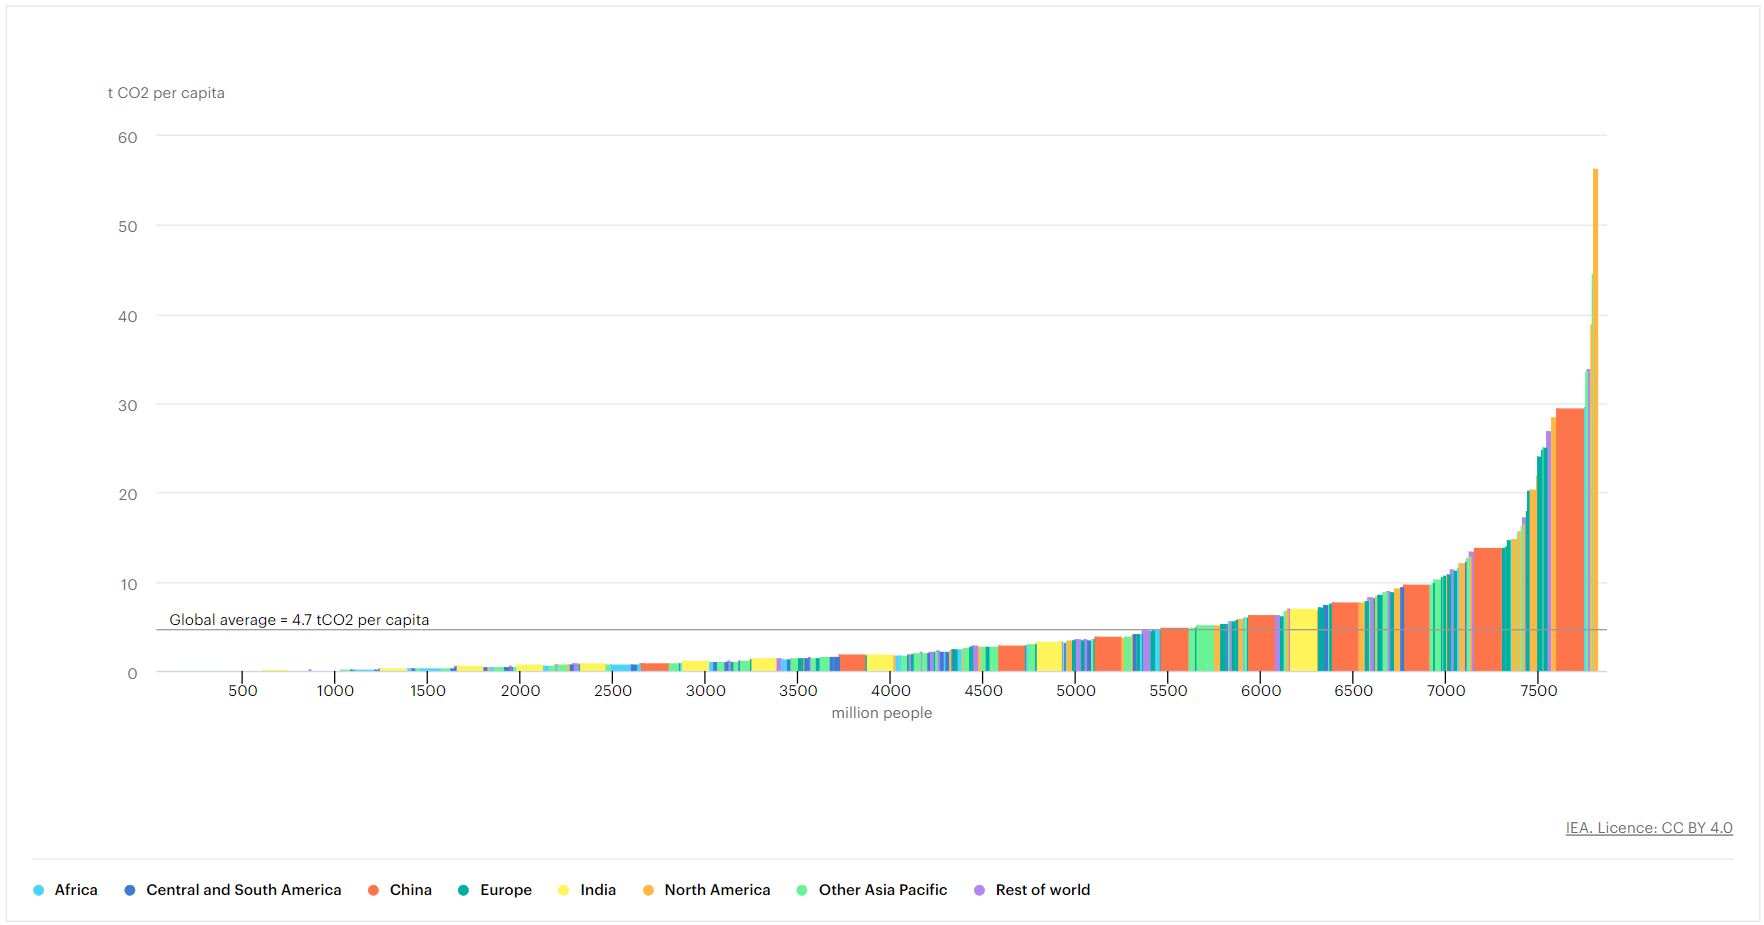
Source: IEA, Energy-related CO2 emissions per capita by income decile by regions, 2021, IEA, Paris https://www.iea.org/data-and-statistics/charts/energy-related-co2-emissions-per-capita-by-income-decile-by-regions-2021, IEA. Licence: CC BY 4.0
What is Climate Change?
According to the United Nations, climate change refers to long-term shifts in temperatures and weather patterns. Such shifts can be natural, due to changes in the sun’s activity or large volcanic eruptions. But since the 1800s, human activities have been the main driver of climate change, primarily due to the burning of fossil fuels like coal, oil and gas (United Nations Climate Action)
NASA defines climate change as; Climate change is a long-term change in the average weather patterns that have come to define Earth’s local, regional and global climates. These changes have a broad range of observed effects that are synonymous with the term (NASA; What is Climate Change).
Climate change describes a change in the average conditions — such as temperature and rainfall — in a region over a long period of time. For example, 20,000 years ago, much of the United States was covered in glaciers. In the United States today, we have a warmer climate and fewer glaciers ( NASA Kids)
Global climate change refers to the average long-term changes over the entire Earth. These include warming temperatures and changes in precipitation, as well as the effects of Earth’s warming, such as:
- Rising sea levels
- Shrinking mountain glaciers
- Ice melting at a faster rate than usual in Greenland, Antarctica and the Arctic
- Changes in flower and plant blooming times.
Earth’s climate has constantly been changing — even long before humans came into the picture. However, scientists have observed unusual changes recently. For example, Earth’s average temperature has been increasing much more quickly than they would expect over the past 150 years. Climate change is one of the defining issues of our time. It is now more certain than ever, based on many lines of evidence, that humans are changing Earth’s climate. The atmosphere and oceans have warmed, which has been accompanied by sea level rise, a strong
decline in Arctic sea ice, and other climate-related changes. The impacts of climate change on people and nature are increasingly apparent. Unprecedented flooding, heat waves, and wildfires have cost billions in damages. Habitats are undergoing rapid shifts in response to changing
temperatures and precipitation patterns.
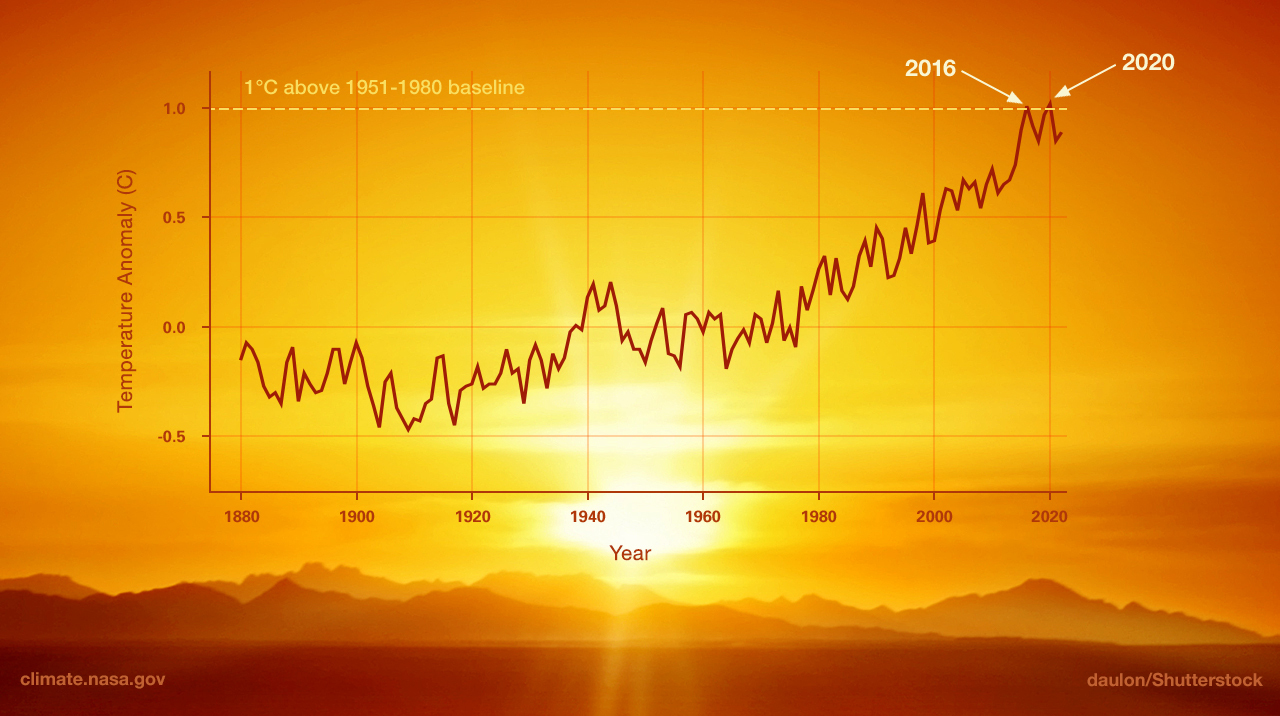
This graph illustrates the change in global surface temperature relative to 1951-1980 average temperatures, with the year 2020 statistically tying with 2016 for hottest on record (Source: NASA’s Goddard Institute for Space Studies).
The U.S. EPA defines climate change as: any significant change in the measures of climate lasting for an extended period of time (30yrs). In other words, climate change includes major changes in temperature, precipitation, or wind patterns, among other effects, that occur over several decades or longer ( www.epa.gov/climatechange/basices/)
As we see, the definitions addressing climate change are similar and interchangeable. The term climate change appeared in the scientific literature before the term global warming, and has been used more frequently in peer-reviewed articles for more than forty years. For example, the closely-related term climatic change was first used in a seminal 1956 paper by Gilbert N. Plass, whereas the term global warming wasn’t used until 1975 by author Wallace Broecker.
What is Global Warming?
Global warming is the long-term heating of Earth’s surface observed since the pre-industrial period (between 1850 and 1900) due to human activities, primarily fossil fuel burning, which increases heat-trapping greenhouse gas levels in Earth’s atmosphere. This term is not interchangeable with the term “climate change.” (NASA). Global warming and climate change have different technical definitions, although they are often used interchangeably in popular media today.
Weather is a specific event for example, it rain today or its sunny and hot…it happens over a few hours, days or even weeks. It describes the short term state of the atmosphere. This includes such conditions as wind, air pressure, precipitation, humidity and temperature. Climate describes the typical, or average, atmospheric conditions. Weather and climate are different as the short term state is always changing but the long-term average is not. Climate is the average of weather.
The mass media, however, widely adopted the term global warming following James Hansen’s widely reported testimony at a Senate hearing in 1988, in which he famously said: “Global warming has reached a level such that we can ascribe with a high degree of confidence a cause and effect relationship between the greenhouse effect and observed warming.1”
The Basics of Climate Change: Greenhouse gases affect Earth’s energy balance and climate
The Sun serves as the primary energy source for Earth’s climate. Some of the incoming sunlight is reflected directly back into space, especially by bright surfaces such as ice and clouds, and the rest is absorbed by the surface and the atmosphere. Much of this absorbed solar energy is re-emitted as heat (longwave or infrared radiation). The atmosphere in turn absorbs and re-radiates heat, some of which escapes to space. Any disturbance to this balance of incoming and outgoing energy will affect the climate. For example, small changes in the output of energy from the Sun will affect this balance directly.
If all heat energy emitted from the surface passed through the atmosphere directly into space, Earth’s average surface temperature would be tens of degrees colder than today. Greenhouse gases in the atmosphere, including water vapor, carbon dioxide, methane, and nitrous oxide, act to make the surface much warmer than this because they absorb and emit heat energy in all directions (including downwards), keeping Earth’s surface and lower atmosphere warm . Without this greenhouse effect, life as we know it could not have evolved on our planet. Adding more greenhouse gases to the atmosphere makes it even more effective at preventing heat from escaping into space. When the energy leaving is less than the energy entering, Earth warms until a new balance is established.
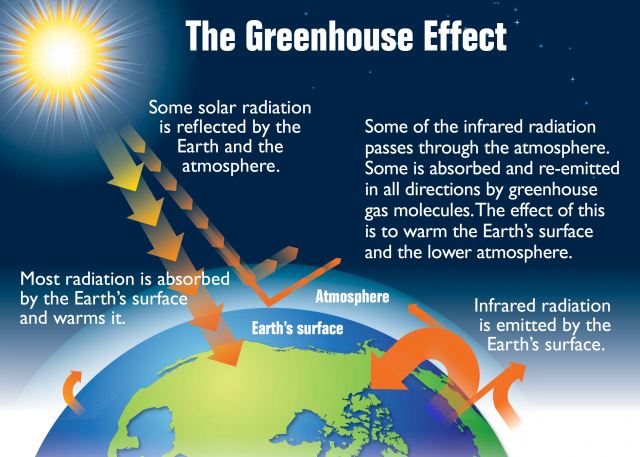
In the figure above, greenhouse gases in the atmosphere, including water vapor, carbon dioxide, methane, and nitrous oxide, absorb heat energy and emit it in all directions (including downwards), keeping Earth’s surface and lower atmosphere warm. Adding more greenhouse gases to the atmosphere
enhances the effect, making Earth’s surface and lower atmosphere even warmer. Image based on a figure from US Environmental Protection
Agency.
Greenhouse gases emitted by human activities alter Earth’s energy balance and thus its climate. Humans also affect climate by changing the nature of the land surfaces (for example by clearing forests for farming) and through the emission of pollutants that affect the amount and type of particles in the atmosphere. Scientists have determined that, when all human and natural factors are considered, Earth’s climate balance has been altered towards warming, with the biggest contributor being increases in CO2.
Even though only a tiny amount of the gases in Earth’s atmosphere are greenhouse gases, they have a huge effect on climate. Sometime during this century, the amount of the greenhouse gas carbon dioxide in the atmosphere is expected to double. Other greenhouse gases like methane and nitrous oxide are increasing as well. The quantity of greenhouse gases is increasing as fossil fuels are burned, releasing the gases and other air pollutants into the atmosphere. Greenhouse gases also make their way to the atmosphere from other sources. Farm animals, for example, release methane gas as they digest food. As cement is made from limestone, it releases carbon dioxide.
Above: (Left) The Earth’s surface, warmed by the Sun, radiates heat into the atmosphere. Some heat is absorbed by greenhouse gases like carbon dioxide and then radiated to space (A). Some heat makes its way to space directly (B). Some heat is absorbed by greenhouse gases and then radiated back towards the Earth’s surface (C). (Right) With more carbon dioxide in the atmosphere later this Century, more heat will be stopped by greenhouse gases, warming the planet. (Image: L.S.Gardiner/UCAR)
Why Greenhouse Gases Make the Planet Warmer
Are human activities adding to greenhouse gases in the atmosphere?
The atmospheric concentrations of carbon dioxide, methane, and nitrous oxide have increased significantly since the Industrial Revolution began. In the case of carbon dioxide, the average concentration measured at the Mauna Loa Observatory in Hawaii has risen from 316 parts per million (ppm = for every million molecules in the air, 316 of them were CO2) in 1959 (the first full year of data available) to more than 420 ppm in 2022 (See figure below). The same rates of increase have since been recorded at numerous other stations worldwide. Since preindustrial times, the atmospheric concentration of CO2 has increased by over 40%, methane has increased by more than 150%, and nitrous oxide has increased by roughly 20%. More than half of the increase in
CO2 has occurred since 1970. Increases in all three gases contribute to warming of Earth, with the increase in CO2 playing the largest role.

Black Curve: Monthly average atmospheric carbon dioxide concentration versus time at Mauna Loa Observatory, Hawaii (20 °N, 156 °W) where CO2 concentration is in parts per million in the mole fraction (p.p.m.). Monthly data are shown as dots and connected with straight lines. The record is distinguished by its pronounced seasonal cycle.
Red Curve: Monthly average atmospheric carbon dioxide concentration versus time at the South Pole, Antarctica where CO2 concentration is in parts per million in the mole fraction (p.p.m.). Monthly data points are shown as dots and connected approximately by a smooth curve.
Scientists have examined greenhouse gases in the context of the past. Analysis of air trapped inside ice that has been accumulating over time in Antarctica shows that the CO2 concentration began to increase significantly in the 19th century ( see figure below), after staying
in the range of 260 to 280 ppm for the previous 10,000 years. Ice core records extending back 800,000 years show that during that time, CO2 concentrations remained within the range of 170 to 300 ppm throughout many “ice age” cycles — and no concentration above 300 ppm is seen in ice core records until the past 200 years.

Merged ice-core record of the time trend of the concentration of CO2, in ppm, in air extracted from an Antarctic ice core combined with the trend based on direct atmospheric measurements.
Open Black Circles: Antarctic ice core record from Law Dome before 1958 (Macfarling Meure, C. et al., 2006: Law Dome CO2, CH4 and N2O ice core records extended to 2000 years BP. Geophysical Research Letters, 33.) Ice core data are rejected after 1958 which overlap direct measurements.
Closed Black Circles: Seasonally detrended arithmetic average of air measurements from Mauna Loa and the South Pole from the Scripps CO2 program after and including 1958.
Source: https://scrippsco2.ucsd.edu/graphics_gallery/mauna_loa_and_south_pole/merged_ice_core_record.html
Measuring isotopes of carbon show in modern atmosphere a clear fingerprint of the addition of old carbon (depleted in natural radioactive 14C) coming from the burning of fossil fuels (as opposed to “newer” carbon coming from living systems). The science shows that it is human activity ( excluding land use changes) emitting an estimated 10 billion tonnes of CO2 each year, and this is primarily from the burning of fossil fuels. This is more than enough to explain the noted increases in CO2 concentrations. Along with this, and other information, it is clear and conclusively that humans are responsible for the elevated carbon dioxide levels in our atmosphere.
Climate records show a warming trend.
Estimating global average surface air temperature increase requires careful analysis of millions of measurements from around the world, including from land stations, ships, and satellites. Despite the many complications of synthesizing such data, multiple independent teams have concluded separately and unanimously that global average surface air temperature has risen by about 1 °C (1.8 °F See figure below) since 1900 . Although the record shows several pauses and accelerations in the increasing trend, each of the last four decades has been warmer than any other decade in the instrumental record since 1850.
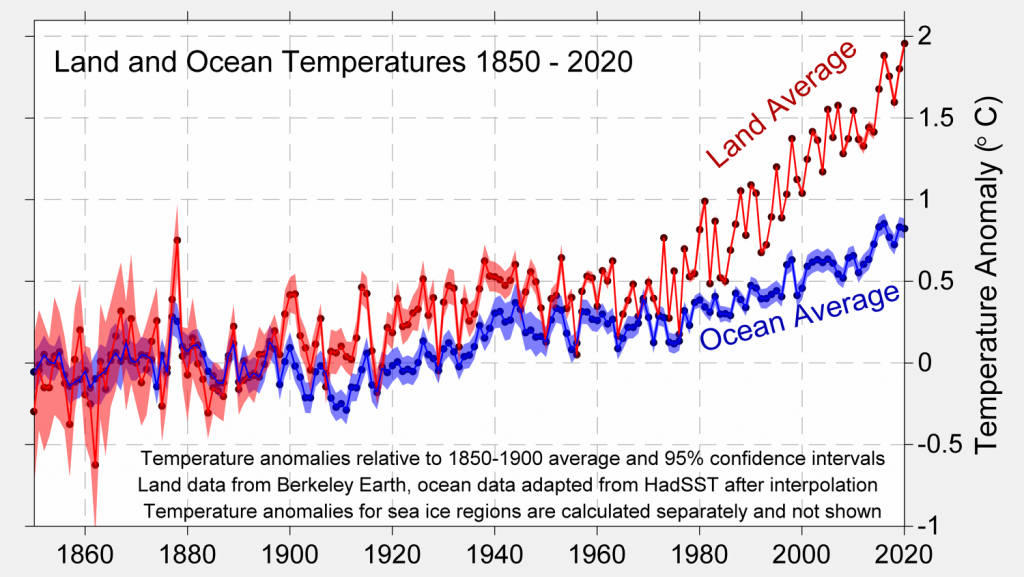
Earth’s global average surface temperature has risen, as shown in this plot of combined land and ocean measurements from 1850 to 2019 derived from
three independent analyses of the available data sets.
Going further back in time before accurate thermometers were widely available, temperatures can be reconstructed using climate-sensitive indicators “proxies” in materials such as tree rings, ice cores, and marine sediments. Comparisons of the thermometer record with these proxy measurements suggest that the time since the early 1980s has been the warmest 40-year period in at least eight centuries, and that global temperature is rising towards peak temperatures last seen 5,000 to 10,000 years ago in the warmest part of our current interglacial period.
Many other impacts associated with the warming trend have become evident in recent years. Arctic summer sea ice cover has shrunk dramatically. The heat content of the ocean as increased. Global average sea level has risen by approximately 16 cm (6 inches) since 1901, due both to the expansion of warmer ocean water and to the addition of melt waters from glaciers and ice sheets on land. Warming and precipitation changes are altering the geographical ranges of many plant and animal species and the timing of their life cycles. In addition to the effects on climate, some of the excess CO2 in the atmosphere is being
taken up by the ocean, changing its chemical composition (causing ocean acidification).
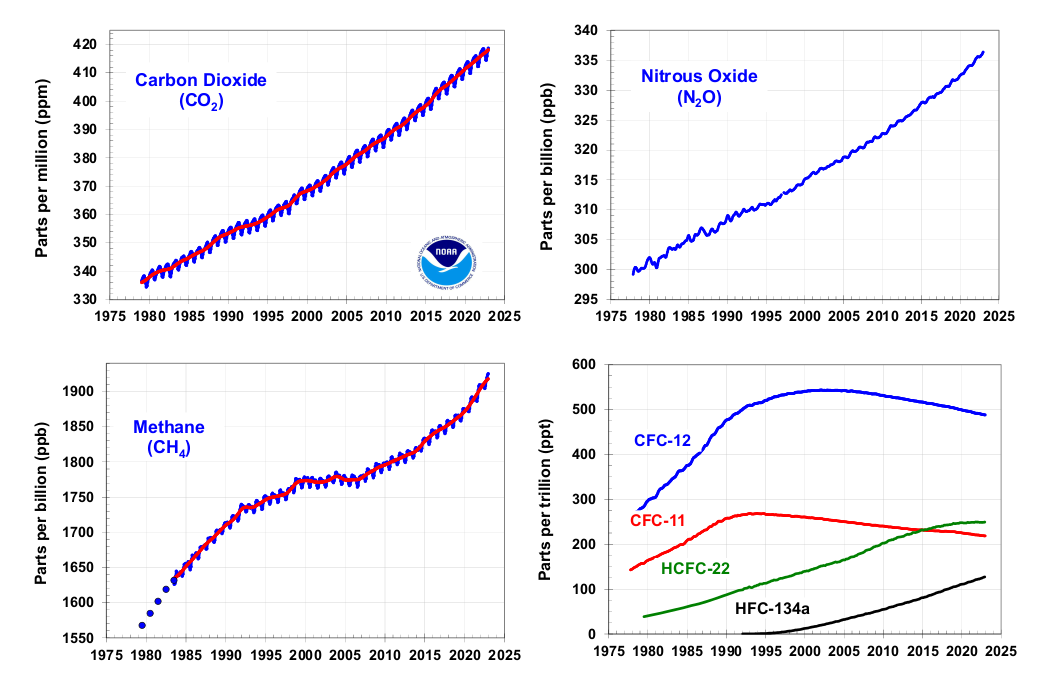
Global average abundances of the major, well-mixed, long-lived greenhouse gases – carbon dioxide, methane, nitrous oxide, CFC-12 and CFC-11 – from the NOAA global air sampling network since the beginning of 1979. These five gases account for about 96% of the direct radiative forcing by long-lived greenhouse gases since 1750. The remaining 4% is contributed by 15 other halogenated gases including HCFC-22 and HFC-134a, for which NOAA observations are also shown here. Methane data before 1983 are annual averages from D. Etheridge [Etheridge et al., 1998], adjusted to the NOAA calibration scale [Dlugokencky et al., 2005]. https://gml.noaa.gov/aggi/aggi.html
Our Climate is complex and is shaped by many process
Based just on the physics of the amount of energy that CO2 absorbs and emits, a doubling of atmospheric CO2 concentration from pre-industrial levels (up to about 560 ppm) would by itself cause a global average temperature increase of about 1 °C (1.8 °F). In the overall climate system, however, things are more complex; warming leads to further effects (feedbacks) that either amplify or diminish the initial warming.
The most important feedbacks involve various forms of water. A warmer atmosphere generally contains more water vapor. Water vapor is a potent greenhouse gas, thus causing more warming; its short lifetime in the atmosphere keeps its increase largely in step with warming. Thus, water vapor is treated as an amplifier, and not a driver, of climate change. Higher temperatures in the polar regions melt sea ice and reduce seasonal snow cover, exposing a darker ocean and land surface that can absorb more heat, causing further warming. Another important but uncertain feedback concerns changes in clouds. Warming and increases in water vapor together may cause cloud cover to increase or decrease which can either amplify or dampen temperature change depending on the changes in the horizontal extent, altitude, and properties of clouds. The latest assessment of the science indicates that the overall net global
effect of cloud changes is likely to be to amplify warming.
The ocean moderates climate change. The ocean is a huge heat reservoir, but it is difficult to heat its full depth because warm water tends to stay near the surface. The rate at which heat is transferred to the deep ocean is therefore slow; it varies from year to year and from decade to decade, and it helps to determine the pace of warming at the surface. Observations of the sub-surface ocean are limited prior to about 1970, but since then, warming of the upper 700 m
(2,300 feet) is readily apparent, and deeper warming is also clearly observed since about 1990.
Surface temperatures and rainfall in most regions vary greatly from the global average because of geographical location, in particular latitude and continental position. Both the average values of temperature, rainfall, and their extremes (which generally have the largest impacts on natural systems and human infrastructure), are also strongly affected by local patterns of winds.
Estimating the effects of feedback processes, the pace of the warming, and regional climate change requires the use of mathematical models of the atmosphere, ocean, land, and ice (the cryosphere) built upon established laws of physics and the latest understanding of the physical, chemical and biological processes affecting climate, and run on powerful computers. Models vary in their projections of how much additional warming to expect (depending on the
type of model and on assumptions used in simulating certain climate processes, particularly cloud formation and ocean mixing), but all such models agree that the overall net effect of feedbacks is to amplify warming.
The climate is changing due to human activities
Rigorous analysis of all data and lines of evidence shows that most of the observed global warming over the past 50 years or so cannot be explained by natural causes and instead requires a significant role for the influence of human activities.
In order to separate the human influence on climate, scientists must consider many natural variations that affect temperature, precipitation, and other aspects of climate from local to global scale, on timescales from days to decades and longer. One natural variation is the El Niño Southern Oscillation (ENSO), an irregular alternation between warming and cooling (lasting about two to seven years) in the equatorial Pacific Ocean that causes significant
year-to-year regional and global shifts in temperature and rainfall patterns. Volcanic eruptions also alter climate, in part increasing the amount of small (aerosol) particles in the stratosphere that reflect or absorb sunlight, leading to a short-term surface cooling lasting typically about two to three years. Over hundreds of thousands of years, slow, recurring variations in Earth’s orbit around the Sun, which alter the distribution of solar energy received by Earth, have been enough to trigger the ice age cycles of the past 800,000 years.
Fingerprinting is a powerful way of studying the causes of climate change. Different influences on climate lead to different patterns seen in climate records. This becomes obvious when scientists probe beyond changes in the average temperature of the planet and look more closely at geographical and temporal patterns of climate change. For example, an increase in the Sun’s energy output will lead to a very different pattern of temperature change (across Earth’s surface and vertically in the atmosphere) compared to that induced by an increase in CO2 concentration. Observed atmospheric temperature changes show a fingerprint much closer to that of a long-term CO2 increase than to that of a fluctuating Sun alone. Scientists routinely test whether purely natural changes in the Sun, volcanic activity, or internal climate variability could plausibly explain the patterns of change they have observed in many different aspects of the climate system. These analyses have shown that the observed climate changes of the past several decades cannot be explained just by natural factors.
What are some of the human causes of climate change?
In addition to emitting greenhouse gases, human activities have also altered Earth’s energy balance through, for example:
- Changes in land use. Changes in the way people use land — for example, for forests, farms, or cities — can lead to both warming and cooling effects locally by changing the reflectivity of Earth’s surfaces (affecting how much sunlight is sent back into space) and by changing how wet a region is.
- Emissions of pollutants (other than greenhouse gases). Some industrial and agricultural processes emit pollutants that produce aerosols (small droplets or particles suspended in the atmosphere). Most aerosols cool Earth by reflecting sunlight back to space. Some aerosols also affect the formation of clouds, which can have a warming or cooling effect depending on their type and location. Black carbon particles (or “soot”) produced when fossil fuels or vegetation are burned generally have a warming effect because they absorb incoming solar radiation.
- Increases in near surface ozone from internal combustion engines, aerosols such as carbon black, mineral dust and aviation-induced exhaust are acting to raise the surface temperature.
| Greenhouse gas | Chemical formula or abbreviation | Lifetime in atmosphere | Global warming potential (100-year) |
| Carbon dioxide | CO2 | Variable | 1 |
| Methane | CH4 | 12 years | 28-36 |
| Nitrous oxide | N2O | 114 years | 298 |
| Hydrofluorocarbons | Abbreviation: HFCs | 1-270 years | 12-14,800 |
| Perfluorocarbons | Abbreviation: PFCs | 2,600-50,000 years | 7,390 |
| Sulfur hexafluoride | SF6 | 3,200 years | 22,800 |
Comparison of common greenhouse gases in the atmosphere.
The History of Climate Change
In 1640 carbon dioxide was discovered by Johann Baptista van Helmolt, Flemish alchemist, determined that air is a mixture of gases. He studied the gas given off when wood and other fuels were burned, which is carbon dioxide, determining that it is not healthy to breathe. In an experiment, he burned coal to see how much carbon dioxide it added to the air. In 1754 the first carbon dioxide detector was invented by Joseph Black, a medical student in Edinburgh, figured out that limewater can be used as a carbon dioxide (CO2) detector. He observed that the normally clear liquid turned milky when exposed to “fixed air,” which is what he called CO2. He started measuring the gas everywhere with his limewater, and found that it was released from mineral water, fermenting yeast, burning coal and oil, cremating corpses, and human exhalation. The limewater instrument was later improved by Lord Cavendish, and became known as the Cavendish Apparatus.
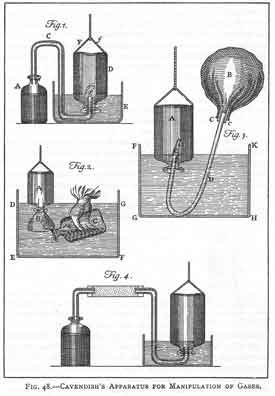
The limewater instrument that Cavendish used to study gases
Around 1760, we have the start of the Industrial Revolution. Since the start of the Industrial Revolution, the way people live and work has changed dramatically as manufacturing expanded. Over time, the amount of fossil fuels burned increased, which has increased the amount of carbon dioxide (CO2) in the atmosphere . Before the Industrial Revolution, there was approximately 280 parts per million (ppm) of CO2 in the air. Today, that amount is over 400 ppm!
In 1824 Jean-Baptiste-Joseph Fourier, a mathematician working for Napoleon, was the first to describe how Earth’s atmosphere retains warmth on what would otherwise be a very cold planet.. To help explain the concept, he compared the atmosphere to the glass walls of a greenhouse. Fourier had studied the up-and-down cycles of temperature between day and night, and between summer and winter, and had measured how deep into the ground these heating and cooling cycles reach. It turns out they don’t go very deep. At about 30 meters below the surface, temperatures remain constant all year round, showing no sign of daily or annual change. The temperature of any object is due to the balance of heat entering and leaving it. If more heat is entering, the object warms up, and if more heat is leaving, it cools down. For the planet as a whole, Fourier pointed out there are only three possible sources of heat: the sun, the Earth’s core, and background heat from space. His measurements showed that the heat at the Earth’s core no longer warms the surface, because the diffusion of heat through layers of rock is too slow to make a noticeable difference.
The solution lay in the behavior of ‘dark heat’, an idea that was new and mysterious to the scientists of the early nineteenth century. Today we call it infra-red radiation. Fourier referred to it as ‘radiant heat’ or ‘dark rays’ to distinguish it from ‘light heat’, or visible light. But really, they’re just different parts of the electromagnetic spectrum. Any object that’s warmer than its surroundings continually radiates some of its heat to those surroundings. If the object is hot enough, say a stove, you can feel this ‘dark heat’ if you put your hand near it, although it has to get pretty hot before we can feel the infra-red it gives off. As you heat up an object, the heat it radiates spreads up the spectrum from infra-red to visible light—it starts to glow red, and then, eventually white hot.

The surface temperature of the Earth is determined by the balance between the incoming heat from the sun (shortwave rays, mainly in the visible light and ultra-violet) and the outgoing infra-red, radiated in all directions from the Earth. The incoming short-wave rays passes through the atmosphere much more easily than the long-wave outgoing infra-red.
To explain the idea, Fourier used an analogy with the hotbox, a kind of solar oven, invented by the explorer Horace Bénédict de Saussure. The hotbox was a very well-insulated wooden box, painted black inside, with three layers of glass in the lid. De Saussure had demonstrated that the sun would heat the inside of the box to over 100°C, and that this temperature remains remarkably consistent, even at the top of Mont Blanc, where the outside air is much colder. The glass lets the sun’s rays through, but slows the rate at which the heat can escape. Fourier argued that layers of air in the atmosphere play a similar role to the panes of glass in the hotbox, by trapping the outgoing heat; like the air in the hotbox, the planet would stay warmer than its surroundings. A century later, Fourier’s theory came to be called the Greenhouse Effect, perhaps because a greenhouse is more familiar to most people than a hotbox.
Today, Fourier is perhaps best remembered for his work on the mathematics of such cycles, and the Fourier transform, a technique for discovering cyclic waveforms in complex data series, was named in his honor.
Later on in the 1800’s hundreds, Eunice Foote, American scientist, discovered that carbon dioxide and water vapor cause air to warm in sunlight. In 1856, she presented her findings at the meeting of the American Association for the Advancement of Science (AAAS). “A paper was read before the late meeting of the Scientific Association, by Prof. Henry for Mrs. Eunice Foot, detailing her experiments to determine the effects of the sun’s rays on different gases,” noted an 1856 article in Scientific America (which is no longer available).
1859; John Tyndall, British physicist, tested the gases in the atmosphere to find out which are responsible for the greenhouse effect. He found that nitrogen and oxygen, which make up almost all of the atmosphere, have no ability to trap heat, but that three gases present in smaller quantities do: carbon dioxide, ozone, and water vapor. Tyndall speculated that if the amounts of these gases dropped, it would chill the Earth.

Tyndall’s experimental equipment for testing the absorption properties of different gases. The brass tube was first evacuated, and the equipment calibrated by moving the screens until the temperature readings from the two heat sources were equal. Then the gas to be tested was pumped into the brass tube, and change in deflection of the galvanometer noted. (Figure adapted from Tyndall, 1861)
When Tyndall filled the tube with dry air, or oxygen, or nitrogen, there was very little change. But when he filled it with the hydrocarbon gas ethene, the temperature at the end of the tube dropped dramatically. This was so surprising that he first suspected something had gone wrong with the equipment—perhaps the gas had reacted with the salt, making the ends opaque? After re-testing every aspect of the equipment, he finally concluded that it was the ethene gas itself that was blocking the heat. He went on to test dozens of other gases and vapors, and found that more complex chemicals such as vapors of alcohols and oils were the strongest heat absorbers, while pure elements such as oxygen and nitrogen had the least effect.
Tyndall concluded that, because of its abundance in the atmosphere, water vapor is responsible for most of the heat trapping effect, with carbon dioxide second. Some of the other vapors he tested have a much stronger absorption effect, but are so rare in the atmosphere they contribute little to the overall effect. Tyndall clearly understood the implications of his experiments for the Earth’s climate, arguing that it explains why, for example, temperatures in dry regions such as deserts drop overnight far more than in more humid regions. In the 1861 paper describing his experimental results, Tyndall argued that any change in the levels of water vapor and carbon dioxide, “must produce a change of climate”. He speculated that “Such changes in fact may have produced all the mutations of climate which the researches of geologists reveal”.
1896; Swedish chemist Svante Arrhenius recognized that burning coal could increase carbon dioxide and warm the climate. He estimated how much carbon dioxide the ocean could absorb. In an 1896 lecture, Arrhenius noted that it was not yet possible to calculate how fast temperature was rising. He also speculated that warming would be beneficial as people in the future “might live under a milder sky and in less barren surroundings.”
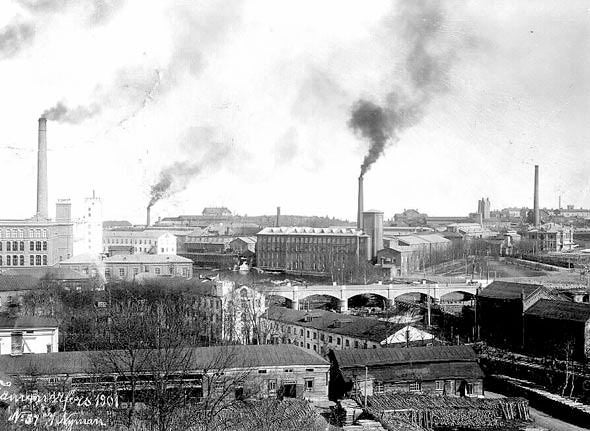
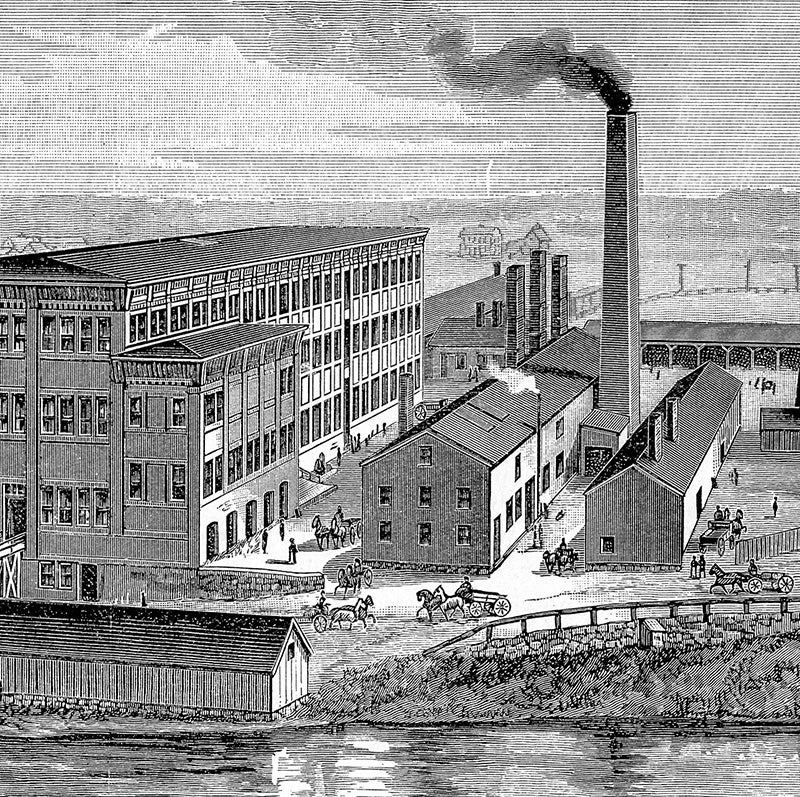
Factory smoke, 1901
1938; British coal engineer George Callendar compiled all carbon dioxide measurements made over the previous 100 years and found that the amount of CO2 was increasing. He also found that temperatures were rising. His conclusion was that this was a good thing, that “the return of the deadly glaciers should be delayed indefinitely.”
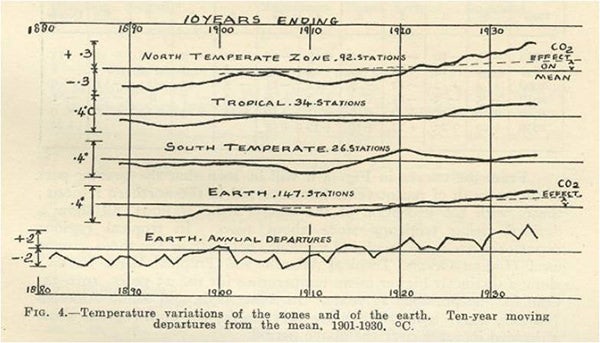
From Callendar’s 1938 paper, The Artificial Production of Carbon Dioxide and its Influence on Temperature
https://rmets.onlinelibrary.wiley.com/doi/abs/10.1002/j.1477-8696.1949.tb00952.x
1957; Roger Revelle, U.S. oceanographer, and Hans Suess, Austrian-born U.S. chemist, realized that carbon dioxide from industrial sources must be building up in the atmosphere, wrote in 1957: “Thus human beings are now carrying out a large scale geophysical experiment of a kind that could not have happened in the past nor be reproduced in the future.”
Measurements since the 1950s indicate that the amount of sea ice in the Arctic has been declining. The Arctic is projected to have no summer ice cover by the middle of this century
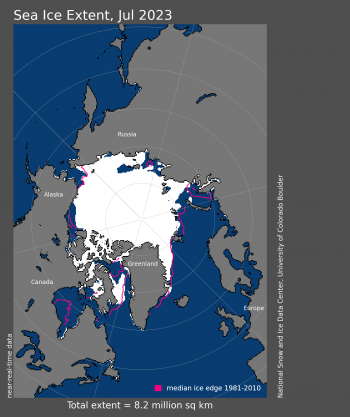
Arctic sea ice extent for July 2023 was 8.18 million square kilometers (3.16 million square miles). The magenta line shows the 1981 to 2010 average extent for that month. Sea Ice Index data. Credit: National Snow and Ice Data Center https://nsidc.org/arcticseaicenews/
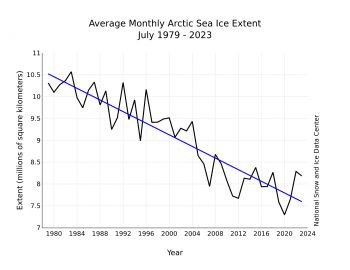
Monthly July ice extent for 1979 to 2023 shows a decline of 7.0 percent per decade. Credit: National Snow and Ice Data Center
1958; The Bell Telephone Science Hour addressed how our actions could be changing Earth’s climate. “Even now, [we] may be unwittingly changing the world’s climate through the waste products of [our] civilization,” said the narrator. “Due to our release from factories and automobiles every year of more than six billion tons of carbon dioxide, which helps the air absorb heat from the Sun, our atmosphere seems to be getting warmer.”
1958; Charles Keeling started making daily measurements of the amount of carbon dioxide in the air atop Mauna Loa in Hawaii. That first March day, he found 313 parts per million (ppm) of carbon dioxide in the air. The measurements, which are still made each day, reached 400 ppm on May 9, 2013, and continue to climb. Today, carbon dioxide levels are at 422 ppm and climbing ( https://climate.nasa.gov/)
The Keeling Curve Hits 410 PPM
1966: At Camp Century, Greenland, an ice core was extracted that showed 8,200 years of annual snow accumulation as thin layers in the ice. The thin layers of ice allowed scientists to reconstruct ancient climate using an ice core for the first time (source; https://nsidc.org/learn).
1988; NASA climate scientist James Hansen testified before the Senate Energy and Natural Resources Committee stating that climate was warming, greenhouse gases are responsible for the warming, and we are responsible for the growth in these gases.
Also in 1988, the Intergovernmental Panel on Climate Change (IPCC) was formed. The IPCC was formed by the World Meteorological Organization and the United Nations to review the latest climate science every few years and help governments around the world understand what we know about climate change, its impacts, and efforts to adapt and mitigate.
1990s: New models were developed to include how the ocean, land, sea ice, and atmosphere interact to affect the climate. At the end of the decade, the National Center for Atmospheric Research ran a new model, the Community Climate System Model (CCSM), on its latest supercomputer to learn more about interactions in Earth’s climate system.
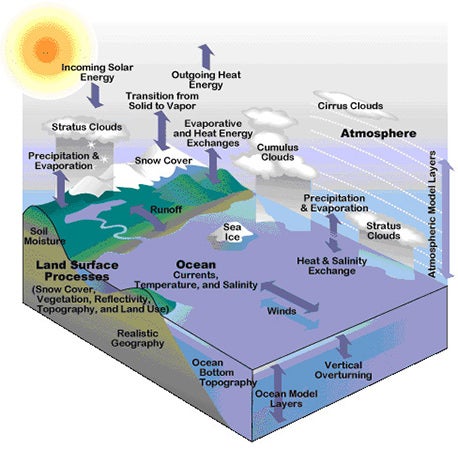
Components of the Community Climate System Model (UCAR)
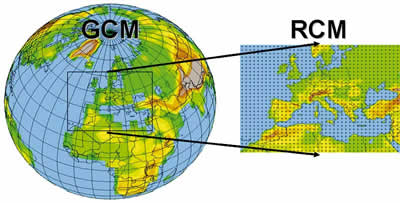
March 1, 1990: Robert Dickinson led a team to create a regional climate model for the western United States in 1989 and, in 1990, Filippo Giorgi simulated regional climate using a model nested in a general circulation model (GCM). Regional climate modeling has allowed predictions of how global climate change impacts local areas.
2006: The Stern Review described the economic impacts of climate change, finding that mitigating (reducing the amount of greenhouse gas emissions) and adapting (making changes to the way we live) would be much less expensive than the cost of trying to recover from the disastrous impacts of climate change in the future. Source: Stern Review on the Economics of Climate Change.
https://webarchive.nationalarchives.gov.uk/ukgwa/+/http:/www.hm-treasury.gov.uk/sternreview_index.htm
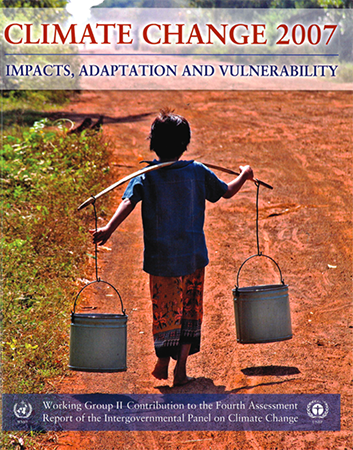
2007: The IPCC Fourth Assessment Report noted that human-caused greenhouse gas emissions had increased 70% between 1970 and 2004 and the effects of climate change were becoming apparent. “Warming of the climate system is unequivocal,” wrote the authors of the 2007 report, “as is now evident from observations of increases in global average air and ocean temperatures, widespread melting of snow and ice and rising global average sea level.”“Anthropogenic [human-caused] warming could lead to some impacts that are abrupt or irreversible,” they warned. “More extensive adaptation than is currently occurring is required to reduce vulnerability to climate change.”
2012: The Rising Voices program has brought indigenous knowledge and western science together to improve understanding of climate change and other types of science and to develop strategies for resilient and sustainable communities.“We need to appreciate the experience and knowledge that has been transferred from generation to generation to generation in Native American communities.” – Bob GoughLearn more: Rising Voices at NCAR
2014: Emissions are the highest in modern times. The IPCC 5th Assessment Report noted that our influence on climate is clear and “recent anthropogenic emissions of greenhouse gases are the highest in history.” The report’s findings led to the Paris Climate Accord, in which nearly all of the world’s countries (174 countries in total) committed to actions limiting warming to below 2° Celsius (3.6° Fahrenheit) in an effort to avoid the most catastrophic impacts. (The United States announced in 2017 that it would back out of the agreement.)
2016 the point of no return? Carbon dioxide stays above 400ppm year round. September is typically when carbon dioxide is at a minimum in its annual cycle. September 2016 was the first time that minimum level was over 400 parts per million. Before large-scale burning of fossil fuels, CO2 levels were about 280 ppm.
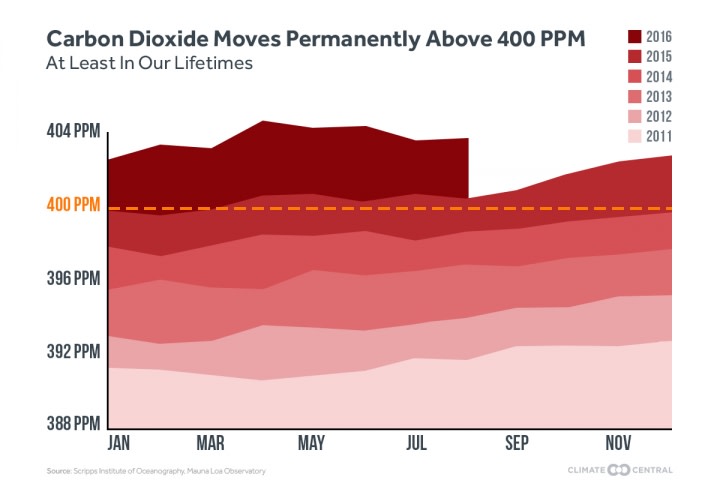
Source: Climate Central https://www.climatecentral.org/news/world-passes-400-ppm-threshold-permanently-20738
2019: Biodiversity is Declining With Earth system models, scientists are now able to study how species and ecosystems around the world are likely to be affected by climate change and other human impacts. According to a 2019 United Nations report, climate change and other human impacts such as pollution and land use are threatening species worldwide. “Around 1 million species already face extinction, many within decades, unless action is taken,” according to the report.
2021: 2016 and 2020 tied as the warmest years on record, according to 2021 reports. Scientists studying long-term temperature records found that the 10 warmest years through 2020 all occurred since 2000. From NASA Goddard Institute for Space Studies Director Gavin Schmidt, “…As the human impact on the climate increases, we have to expect that records will continue to be broken.“
NASA Finds 2020 Tied for Hottest Year on Record
Globally, 2020 was the hottest year on record, effectively tying 2016, the previous record. Overall, Earth’s average temperature has risen more than 2 degrees Fahrenheit since the 1880s. Temperatures are increasing due to human activities, specifically emissions of greenhouse gases, like carbon dioxide and methane. (Credits: NASA’s Scientific Visualization Studio/Lori Perkins/Kathryn Mersmann)
2021 Tied for 6th Warmest Year in Continued Trend. NASA analysis shows, 2012 was tied for the sixth warmest year on NASA’s record, stretching more than a century. Because the record is global, not every place on Earth experienced the sixth warmest year on record. Some places had record-high temperatures, and we saw record droughts, floods and fires around the globe.
Collectively, the past eight years are the warmest years since modern recordkeeping began in 1880. This annual temperature data makes up the global temperature record— which tells scientists the planet is warming.
According to NASA’s temperature record, Earth in 2021 was about 1.9 degrees Fahrenheit (or about 1.1 degrees Celsius) warmer than the late 19th century average, the start of the industrial revolution.(Credit: NASA/GSFC/SVS/Kathryn Mersmann: https://www.giss.nasa.gov/research/news/20220113/
2022: Climate impacts are past the natural climate variability. According to the The Sixth Assessment Report from the IPCC highlights the impacts of human-induced climate change, including more frequent and intense extreme events. The changes have caused widespread adverse impacts and damages to nature and people, beyond what would be expected from natural climate variability (Source: IPCC Sixth Assessment Report https://www.ipcc.ch/report/ar6/wg2/resources/spm-headline-statements/
Consequences of Climate Change
We need to understand planet Earth so we can benefit humankind.
Carbon Dioxide = 422 ppm and rising
Methane = 1923.6 ppb and rising
Global Temperature = 1.10 C ( 20 F ) Since preindustrial and increasing
Artic Sea Ice Minimum Extent = 12.6 % per decade and declining
Ocean Warming = 345 zettajoules since 1955 (The zettajoule is equal to one sextillion (1021) joules, or units of heat energy. The amount of heat energy the ocean has absorbed over the past 6-plus decades is more than eight times the amount of energy humans used over that time for cooking, electricity, industry, heating, etc.).
Ice Sheets = 424 billion tons per year and declining
Sea Level = 4 inches since January 1993 and increasing
(Source: NASA Global Climate Change Vital Signs of the Planet. https://climate.nasa.gov/)
“Since systematic scientific assessments began in the 1970s, the influence of human activity on the warming of the climate system has evolved from theory to established fact.”
Communities:
The impacts of climate change are already being felt in communities across the country. More frequent and intense extreme weather and climate-related events, as well as changes in average climate conditions, are expected to continue to damage infrastructure, ecosystems, and social systems that provide essential benefits to communities. Future climate change is expected to further disrupt many areas of life, exacerbating existing challenges to prosperity posed by aging and deteriorating infrastructure, stressed ecosystems, and economic inequality. Impacts within and across regions will not be distributed equally. People who are already vulnerable, including lower-income and other marginalized communities, have lower capacity to prepare for and cope with extreme weather and climate-related events and are expected to experience greater impacts. Prioritizing adaptation actions for the most vulnerable populations would contribute to a more equitable future within and across communities. Global action to significantly cut greenhouse gas emissions can substantially reduce climate-related risks and increase opportunities for these populations in the longer term
Climate change creates new risks and exacerbates existing vulnerabilities in communities across the United States, presenting growing challenges to human health and safety, quality of life, and the rate of economic growth.
Economy:
Without substantial and sustained global mitigation and regional adaptation efforts, climate change is expected to cause growing losses to American infrastructure and property and impede the rate of economic growth over this century.
In the absence of significant global mitigation action and regional adaptation efforts, rising temperatures, sea level rise, and changes in extreme events are expected to increasingly disrupt and damage critical infrastructure and property, labor productivity, and the vitality of our communities. Regional economies and industries that depend on natural resources and favorable climate conditions, such as agriculture, tourism, and fisheries, are vulnerable to the growing impacts of climate change. Rising temperatures are projected to reduce the efficiency of power generation while increasing energy demands, resulting in higher electricity costs. The impacts of climate change beyond our borders are expected to increasingly affect our trade and economy, including import and export prices and U.S. businesses with overseas operations and supply chains. Some aspects of our economy may see slight near-term improvements in a modestly warmer world. However, the continued warming that is projected to occur without substantial and sustained reductions in global greenhouse gas emissions is expected to cause substantial net damage to the U.S. economy throughout this century, especially in the absence of increased adaptation efforts. With continued growth in emissions at historic rates, annual losses in some economic sectors are projected to reach hundreds of billions of dollars by the end of the century—more than the current gross domestic product (GDP) of many U.S. states.
Interconnected Impacts:
Climate change affects the natural, built, and social systems we rely on individually and through their connections to one another. These interconnected systems are increasingly vulnerable to cascading impacts that are often difficult to predict, threatening essential services within and beyond the Nation’s borders.
Climate change presents added risks to interconnected systems that are already exposed to a range of stressors such as aging and deteriorating infrastructure, land-use changes, and population growth. Extreme weather and climate-related impacts on one system can result in increased risks or failures in other critical systems, including water resources, food production and distribution, energy and transportation, public health, international trade, and national security. The full extent of climate change risks to interconnected systems, many of which span regional and national boundaries, is often greater than the sum of risks to individual sectors. Failure to anticipate interconnected impacts can lead to missed opportunities for effectively managing the risks of climate change and can also lead to management responses that increase risks to other sectors and regions. Joint planning with stakeholders across sectors, regions, and jurisdictions can help identify critical risks arising from interaction among systems ahead of time.
Water:
The quality and quantity of water available for use by people and ecosystems across the country are being affected by climate change, increasing risks and costs to agriculture, energy production, industry, recreation, and the environment.
Rising air and water temperatures and changes in precipitation are intensifying droughts, increasing heavy downpours, reducing snowpack, and causing declines in surface water quality, with varying impacts across regions. Future warming will add to the stress on water supplies and adversely impact the availability of water in parts of the United States. Changes in the relative amounts and timing of snow and rainfall are leading to mismatches between water availability and needs in some regions, posing threats to, for example, the future reliability of hydropower production in the Southwest and the Northwest. Groundwater depletion is exacerbating drought risk in many parts of the United States, particularly in the Southwest and Southern Great Plains. Dependable and safe water supplies for U.S. Caribbean, Hawai‘i, and U.S.-Affiliated Pacific Island communities are threatened by drought, flooding, and saltwater contamination due to sea level rise. Most U.S. power plants rely on a steady supply of water for cooling, and operations are expected to be affected by changes in water availability and temperature increases. Aging and deteriorating water infrastructure, typically designed for past environmental conditions, compounds the climate risk faced by society. Water management strategies that account for changing climate conditions can help reduce present and future risks to water security, but implementation of such practices remains limited.
Health:
Impacts from climate change on extreme weather and climate-related events, air quality, and the transmission of disease through insects and pests, food, and water increasingly threaten the health and well-being of the American people, particularly populations that are already vulnerable.
Changes in temperature and precipitation are increasing air quality and health risks from wildfire and ground-level ozone pollution. Rising air and water temperatures and more intense extreme events are expected to increase exposure to waterborne and foodborne diseases, affecting food and water safety. With continued warming, cold-related deaths are projected to decrease and heat-related deaths are projected to increase; in most regions, increases in heat-related deaths are expected to outpace reductions in cold-related deaths. The frequency and severity of allergic illnesses, including asthma and hay fever, are expected to increase as a result of a changing climate. Climate change is also projected to alter the geographic range and distribution of disease-carrying insects and pests, exposing more people to ticks that carry Lyme disease and mosquitoes that transmit viruses such as Zika, West Nile, and dengue, with varying impacts across regions. Communities in the Southeast, for example, are particularly vulnerable to the combined health impacts from vector-borne disease, heat, and flooding. Extreme weather and climate-related events can have lasting mental health consequences in affected communities, particularly if they result in degradation of livelihoods or community relocation. Populations including older adults, children, low-income communities, and some communities of color are often disproportionately affected by, and less resilient to, the health impacts of climate change. Adaptation and mitigation policies and programs that help individuals, communities, and states prepare for the risks of a changing climate reduce the number of injuries, illnesses, and deaths from climate-related health outcomes.
Indigenous Peoples:
Climate change increasingly threatens Indigenous communities’ livelihoods, economies, health, and cultural identities by disrupting interconnected social, physical, and ecological systems.
Many Indigenous peoples are reliant on natural resources for their economic, cultural, and physical well-being and are often uniquely affected by climate change. The impacts of climate change on water, land, coastal areas, and other natural resources, as well as infrastructure and related services, are expected to increasingly disrupt Indigenous peoples’ livelihoods and economies, including agriculture and agroforestry, fishing, recreation, and tourism. Adverse impacts on subsistence activities have already been observed. As climate changes continue, adverse impacts on culturally significant species and resources are expected to result in negative physical and mental health effects. Throughout the United States, climate-related impacts are causing some Indigenous peoples to consider or actively pursue community relocation as an adaptation strategy, presenting challenges associated with maintaining cultural and community continuity. While economic, political, and infrastructure limitations may affect these communities’ ability to adapt, tightly knit social and cultural networks present opportunities to build community capacity and increase resilience. Many Indigenous peoples are taking steps to adapt to climate change impacts structured around self-determination and traditional knowledge, and some tribes are pursuing mitigation actions through development of renewable energy on tribal lands.
Ecosystems and Ecosystem Services:
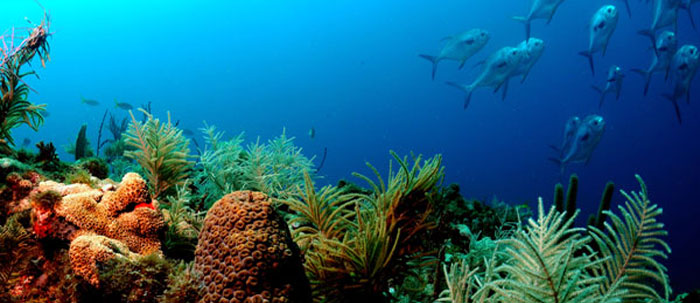
Ecosystems and the benefits they provide to society are being altered by climate change, and these impacts are projected to continue. Without substantial and sustained reductions in global greenhouse gas emissions, transformative impacts on some ecosystems will occur; some coral reef and sea ice ecosystems are already experiencing such transformational changes.
Many benefits provided by ecosystems and the environment, such as clean air and water, protection from coastal flooding, wood and fiber, crop pollination, hunting and fishing, tourism, cultural identities, and more will continue to be degraded by the impacts of climate change. Increasing wildfire frequency, changes in insect and disease outbreaks, and other stressors are expected to decrease the ability of U.S. forests to support economic activity, recreation, and subsistence activities. Climate change has already had observable impacts on biodiversity, ecosystems, and the benefits they provide to society. These impacts include the migration of native species to new areas and the spread of invasive species. Such changes are projected to continue, and without substantial and sustained reductions in global greenhouse gas emissions, extinctions and transformative impacts on some ecosystems cannot be avoided in the long term. Valued aspects of regional heritage and quality of life tied to ecosystems, wildlife, and outdoor recreation will change with the climate, and as a result, future generations can expect to experience and interact with the natural environment in ways that are different from today. Adaptation strategies, including prescribed burning to reduce fuel for wildfire, creation of safe havens for important species, and control of invasive species, are being implemented to address emerging impacts of climate change. While some targeted response actions are underway, many impacts, including losses of unique coral reef and sea ice ecosystems, can only be avoided by significantly reducing global emissions of carbon dioxide and other greenhouse gases.
Agriculture:
Rising temperatures, extreme heat, drought, wildfire on rangelands, and heavy downpours are expected to increasingly disrupt agricultural productivity in the United States. Expected increases in challenges to livestock health, declines in crop yields and quality, and changes in extreme events in the United States and abroad threaten rural livelihoods, sustainable food security, and price stability.
Climate change presents numerous challenges to sustaining and enhancing crop productivity, livestock health, and the economic vitality of rural communities. While some regions (such as the Northern Great Plains) may see conditions conducive to expanded or alternative crop productivity over the next few decades, overall, yields from major U.S. crops are expected to decline as a consequence of increases in temperatures and possibly changes in water availability, soil erosion, and disease and pest outbreaks. Increases in temperatures during the growing season in the Midwest are projected to be the largest contributing factor to declines in the productivity of U.S. agriculture. Projected increases in extreme heat conditions are expected to lead to further heat stress for livestock, which can result in large economic losses for producers. Climate change is also expected to lead to large-scale shifts in the availability and prices of many agricultural products across the world, with corresponding impacts on U.S. agricultural producers and the U.S. economy. These changes threaten future gains in commodity crop production and put rural livelihoods at risk. Numerous adaptation strategies are available to cope with adverse impacts of climate variability and change on agricultural production. These include altering what is produced, modifying the inputs used for production, adopting new technologies, and adjusting management strategies. However, these strategies have limits under severe climate change impacts and would require sufficient long- and short-term investment in changing practices.
Infrastructure:
Our Nation’s aging and deteriorating infrastructure is further stressed by increases in heavy precipitation events, coastal flooding, heat, wildfires, and other extreme events, as well as changes to average precipitation and temperature. Without adaptation, climate change will continue to degrade infrastructure performance over the rest of the century, with the potential for cascading impacts that threaten our economy, national security, essential services, and health and well-being.
Climate change and extreme weather events are expected to increasingly disrupt our Nation’s energy and transportation systems, threatening more frequent and longer-lasting power outages, fuel shortages, and service disruptions, with cascading impacts on other critical sectors. Infrastructure currently designed for historical climate conditions is more vulnerable to future weather extremes and climate change. The continued increase in the frequency and extent of high-tide flooding due to sea level rise threatens America’s trillion-dollar coastal property market and public infrastructure, with cascading impacts to the larger economy. In Alaska, rising temperatures and erosion are causing damage to buildings and coastal infrastructure that will be costly to repair or replace, particularly in rural areas; these impacts are expected to grow without adaptation. Expected increases in the severity and frequency of heavy precipitation events will affect inland infrastructure in every region, including access to roads, the viability of bridges, and the safety of pipelines. Flooding from heavy rainfall, storm surge, and rising high tides is expected to compound existing issues with aging infrastructure in the Northeast. Increased drought risk will threaten oil and gas drilling and refining, as well as electricity generation from power plants that rely on surface water for cooling. Forward-looking infrastructure design, planning, and operational measures and standards can reduce exposure and vulnerability to the impacts of climate change and reduce energy use while providing additional near-term benefits, including reductions in greenhouse gas emissions.
Oceans & Coasts:
Coastal communities and the ecosystems that support them are increasingly threatened by the impacts of climate change. Without significant reductions in global greenhouse gas emissions and regional adaptation measures, many coastal regions will be transformed by the latter part of this century, with impacts affecting other regions and sectors. Even in a future with lower greenhouse gas emissions, many communities are expected to suffer financial impacts as chronic high-tide flooding leads to higher costs and lower property values.
Rising water temperatures, ocean acidification, retreating arctic sea ice, sea level rise, high-tide flooding, coastal erosion, higher storm surge, and heavier precipitation events threaten our oceans and coasts. These effects are projected to continue, putting ocean and marine species at risk, decreasing the productivity of certain fisheries, and threatening communities that rely on marine ecosystems for livelihoods and recreation, with particular impacts on fishing communities in Hawai‘i and the U.S.-Affiliated Pacific Islands, the U.S. Caribbean, and the Gulf of Mexico. Lasting damage to coastal property and infrastructure driven by sea level rise and storm surge is expected to lead to financial losses for individuals, businesses, and communities, with the Atlantic and Gulf Coasts facing above-average risks. Impacts on coastal energy and transportation infrastructure driven by sea level rise and storm surge have the potential for cascading costs and disruptions across the country. Even if significant emissions reductions occur, many of the effects from sea level rise over this century—and particularly through mid-century—are already locked in due to historical emissions, and many communities are already dealing with the consequences. Actions to plan for and adapt to more frequent, widespread, and severe coastal flooding, such as shoreline protection and conservation of coastal ecosystems, would decrease direct losses and cascading impacts on other sectors and parts of the country. More than half of the damages to coastal property are estimated to be avoidable through well-timed adaptation measures. Substantial and sustained reductions in global greenhouse gas emissions would also significantly reduce projected risks to fisheries and communities that rely on them.
Tourism and Recreation:
Outdoor recreation, tourist economies, and quality of life are reliant on benefits provided by our natural environment that will be degraded by the impacts of climate change in many ways.
Climate change poses risks to seasonal and outdoor economies in communities across the United States, including impacts on economies centered around coral reef-based recreation, winter recreation, and inland water-based recreation. In turn, this affects the well-being of the people who make their living supporting these economies, including rural, coastal, and Indigenous communities. Projected increases in wildfire smoke events are expected to impair outdoor recreational activities and visibility in wilderness areas. Declines in snow and ice cover caused by warmer winter temperatures are expected to negatively impact the winter recreation industry in the Northwest, Northern Great Plains, and the Northeast. Some fish, birds, and mammals are expected to shift where they live as a result of climate change, with implications for hunting, fishing, and other wildlife-related activities. These and other climate-related impacts are expected to result in decreased tourism revenue in some places and, for some communities, loss of identity. While some new opportunities may emerge from these ecosystem changes, cultural identities and economic and recreational opportunities based around historical use of and interaction with species or natural resources in many areas are at risk. Proactive management strategies, such as the use of projected stream temperatures to set priorities for fish conservation, can help reduce disruptions to tourist economies and recreation.
The Northeast: i.e. “New Jersey”
Annual average temperature have risen more than 3.5o F in the Garden State since the beginning of the 20th century. If emission keep on the projected path, NJ will see continuing warming trends during this century. Heat waves will be more frequent and more intense. Cold waves are projected to me less intense.
New Jersey’s geographic position in the mid-latitudes often places it near the jet stream, particularly in the late fall, winter, and spring, giving the state its characteristic varied weather. Precipitation is frequent because low-pressure storms associated with the jet stream commonly affect the state. In addition, New Jersey’s location on the eastern coast of North America exposes it to the cold winter and warm summer air masses of the continental interior and the moderate and moist air masses of the western Atlantic Ocean. In winter, the contrast between the frigid air masses of the continental interior and the relatively warm Atlantic provides the energy for occasional intense storms known as nor’easters. As a result of these influences, New Jersey’s climate is characterized by moderately cold and occasionally snowy winters and warm, humid summers. There is a west-to-east contrast of temperatures, with cooler temperatures in the higher elevations of the northwest and warmer temperatures in the east near the coast. Temperature differences from the northwest to southeast are most noticeable in the winter. The northern elevated highlands and valleys experience colder temperatures and more annual average precipitation than the rest of the state. Average minimum temperatures in January range from 15° to 20°F in the northwest to 25° to 30°F along the coast. A similar temperature gradient exists for average maximum temperatures in July—cooler summertime temperatures of 80° to 85°F occur in the northwestern corner and temperatures between 85° and 90°F occur in the rest of the state. The statewide annual average precipitation is 47.6 inches. There is a north-south precipitation gradient as well, with the north-central portion of the state averaging around 50 inches of precipitation and the coastal region averaging 40–45 inches.
New Jersey is located about halfway between the Equator and the North Pole, on the eastern coast of the United States. Its geographic location results in the State being influenced by wet, dry, hot, and cold airstreams, making for daily weather that is highly variable
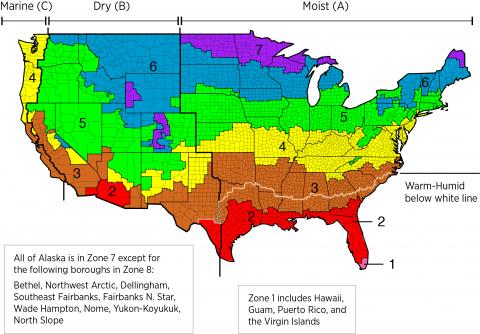
The map above shows the 7 different climate zones of the United States. The lower 2/3 of New Jersey is in climate zone 4 while the upper regions are in climate zone 5. Source: 2012 International Energy Conservation Code (IECC) International Code Council

Temperatures in New Jersey have risen more than 3.5°F since the beginning of the 20th century (See figure below). All of the 10 hottest calendar years on record for the state have occurred since 1990, and six have occurred since 2010. The year 2012 was the warmest on record at 3.0°F above average, and 2020 was the second warmest on record at 2.6°F above average. The number of very hot days has been varied (Figure 2a). The number of warm nights in New Jersey has consistently been above the long-term average since the early 2000s, with the highest 5-year average occurring during the 2010–2014 period (Figure 3). The number of very cold nights has been below average since the early 1990s (Figure 2b). Over the past 25 years, there have been many more unusually warm months than unusually cold months in New Jersey. During the 2000–2020 interval, there were no top 5 coldest months, but there were 38 top 5 warmest months.

Figure 1
The New Jersey annual average temperature for the 1991–2020 normals period of 53.56 °F is 0.70 °F warmer than the 1981–2010 normal of 52.86 °F. The monthly temperature differences between the two normals periods ranges from zero in November to as much as 1.4 °F in December.

The monthly normals for the two periods are plotted alongside each other in the figure above
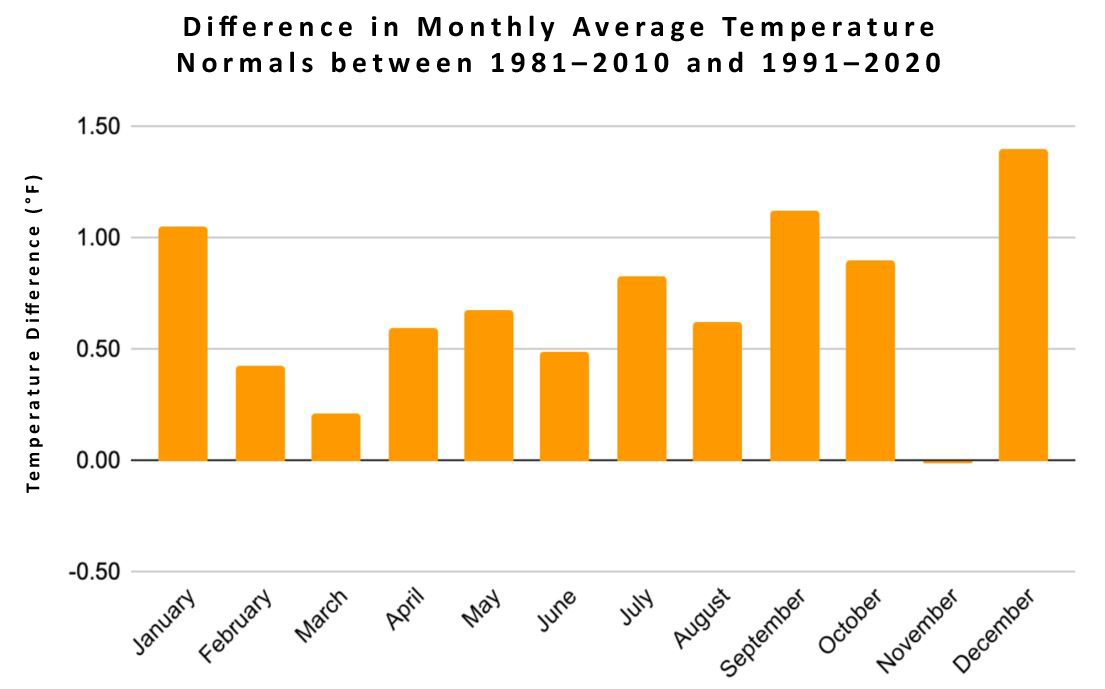
Monthly differences in average temperature normals between the 1981–2010 and 1991–2020 periods. Positive values indicate the more recent 30-year interval is warmer than the prior one. From viewing both perspectives of average temperature, the warm season —May to October — is consistently warming. The cool season, November to April, also warms but shows more month-to-month fluctuations than the warm season. Source Comparing the 1981–2010 and 1991–2020 Normals October 21, 2022 – 4:44pm — Erica Langer https://www.njweather.org/content/comparing-1981%E2%80%932010-and-1991%E2%80%932020-normals
Total annual precipitation for New Jersey has been about 3.7 inches above average over the last 16 years (Figure 2c). The driest conditions were in the 1960s, and near normal to wet conditions have occurred since the 1970s. The wettest consecutive 5 years was the 1971–1975 interval, and the driest was the 1962–1966 interval. The number of 2-inch extreme precipitation events was well above average during 2005–2014 but has been slightly below average since then. During 2010–2014, the state experienced the greatest number of 2-inch extreme precipitation events, about 50% above the long-term average. Summer precipitation has been above the long-term average during this century, with the highest 5-year average occurring during the 2010–2014 period. The state can also experience short-term droughts, such as in 2002, 2010, and 2016–2017 and the summer of 2022.
![[object Object]](https://statesummaries.ncics.org/img/figure/nj-figure-2c.png)
Figure 2c
Extreme weather events typically experienced in the state include coastal nor’easters, snowstorms, spring and summer thunderstorms, flooding rains, heat and cold waves, tropical storms, and on rare occasions, hurricanes. The state’s coastline is highly vulnerable to damage from coastal storms, which include nor’easters, tropical storms, and hurricanes. Damaging nor’easters are most common between October and April, and those tracking over or near the coast can bring strong winds and heavy precipitation. Annually, the state experiences at least one coastal storm, but some years have seen as many as 5 to 10 storm events. The most extreme and destructive event to affect New Jersey in recent years was Superstorm Sandy in 2012. The powerful storm surge, the most destructive element of Sandy, reached 9–10 feet above normal in some areas along the coast. This was caused by strong winds and an unusual west-northwestward track. New Jersey experienced extensive damage from severe winds and coastal flooding, with an estimated $29.4 billion in repair, response, and restoration costs. February 2010 brought three winter storms to the state, causing Atlantic City to have their snowiest month on record. The blizzard of 2016 brought high winds and heavy snow; Bayville, NJ, had gusts of 72 mph and many beaches experienced moderate to major erosion.
Under a higher emissions pathway, historically unprecedented warming is projected during this century (Figure 1). Even under a lower emissions pathway, temperatures are projected to most likely exceed historical record levels by the middle of this century. However, a large range of temperature increases is projected under both pathways, and under the lower pathway, a few projections are only slightly warmer than historical records (Figure 1 above). Increases in the number of extremely hot days and decreases in the number of extremely cold days are projected to accompany the overall warming. According to a state-level analysis, by the middle of this century an estimated 70% of summers in this region are anticipated to be hotter than what we now recognize as the warmest summer on record.
Winter and spring precipitation and extreme precipitation events are projected to increase in this century (Figure 5). The projections of increasing precipitation and heavy precipitation events are true for a large area of the Northern Hemisphere in the northern middle latitudes. This may result in increased coastal and inland flooding risks throughout the state.

Figure 5: Projected changes in total spring (March–May) precipitation (%) for the middle of the 21st century compared to the late 20th century under a higher emissions pathway. The whited-out area indicates that the climate models are uncertain about the direction of change. Hatching represents areas where the majority of climate models indicate a statistically significant change. New Jersey is part of a large area of projected increases in spring precipitation in the northeastern and central United States. Source: CISESS and NEMAC. Data: CMIP5.
Since 1900, global average sea level has risen by about 7–8 inches. It is projected to rise another 1–8 feet, with a likely range of 1–4 feet, by 2100 as a result of both past and future emissions from human activities (Figure 6). Even greater rises are projected along the New Jersey coast because of land subsidence. Sea level along the coast of New Jersey has also risen faster than the global average. Observations beginning in 1911 show sea level has risen at an average rate of 1.6 inches per decade, about double the global rate, over the period of record at Atlantic City. Sea level rise has caused an increase in tidal floods associated with nuisance-level impacts. Nuisance floods are events in which water levels exceed the local threshold (set by NOAA’s National Weather Service) for minor impacts. These events can damage infrastructure, cause road closures, and overwhelm storm drains. As sea level has risen along the New Jersey coastline, the number of tidal flood days (all days exceeding the nuisance-level threshold) has also increased, with the greatest number occurring in 2017 (Figure 7). Coastal flooding caused by sea level rise has important future cross-sector implications for public health, water resources, and coastal ecosystems.

Figure 6: Global mean sea level (GMSL) change from 1800 to 2100. Projections include the six U.S. Interagency Sea Level Rise Task Force GMSL scenarios (Low, navy blue; Intermediate-Low, royal blue; Intermediate, cyan; Intermediate-High, green; High, orange; and Extreme, red curves) relative to historical geological, tide gauge, and satellite altimeter GMSL reconstructions from 1800–2015 (black and magenta lines) and the very likely ranges in 2100 under both lower and higher emissions futures (teal and dark red boxes). Global sea level rise projections range from 1 to 8 feet by 2100, with a likely range of 1 to 4 feet. Source: adapted from Sweet et al. 2017.
![[object Object]](https://statesummaries.ncics.org/img/figure/nj-figure-7.png)
Figure 7: Number of tidal flood days per year at Atlantic City, NJ, for the observed record (1923–2020; orange bars) and projections for 2 NOAA (2017) sea level rise scenarios (2021–2100): Intermediate (dark blue bars) and Intermediate-Low (light blue bars). The NOAA (2017) scenarios are based on local projections of the GMSL scenarios shown in Figure 6. Sea level rise has caused a gradual increase in tidal floods associated with nuisance-level impacts. The greatest number of tidal flood days (all days exceeding the nuisance-level threshold) occurred in 2017 at Atlantic City. Projected increases are large even under a the Intermediate-Low scenario. Under the Intermediate scenario, tidal flooding is projected to occur nearly every day of the year by the end of the century. Additional information on tidal flooding observations and scenarios is available at https://statesummaries.ncics.org/technicaldetails. Sources: CISESS and NOAA NOS.
Climate Change Solutions:
According to the UN environmental programme ( https://www.unep.org/interactive/six-sector-solution-climate-change/) UNEP’s six sector solution can reduce 29-32 GT CO2e and will limit temperature rise to 1.50C…here is the roadmap for the key 6 sectors:
Buildings and Cities
- Retrofit public buildings
- Promote the installation of heat pumps, solar cells and heat storage technology
- Incentivize the installation of central cooling and heating and the use of energy efficient lighting and appliances
- Set carbon-neutral building standards for new construction
- Mainstream sustainable building within urban and rural planning
- Incentivize mini-grid solutions, district heating and cooling and waste to energy systems
- Plan cities for strategic density and mixed use of buildings and urban fabric, so that neighborhoods have the services they need at the local scale
- Integrate grey, blue and green infrastructure to manage resources and runoff with minimal impact to the environment
- Invest in physical and market infrastructure to better link rural and urban producers and consumers
- Develop smart systems to integrate buildings, mobility and energy systems, including traffic management, distributed EV-charging and integrated planning processes
Energy:
- Commit to more ambitious Nationally Determined Contributions and energy transition strategies
- Set national and sub-national decarbonization and net-zero carbon targets
- Halt policies that support the fossil fuel industry, including excessive subsidies
- Introduce policies that incentivize renewable energy and promote energy efficiency
- Monitor and reduce your company’s energy usage and strive for energy efficiency
- Embrace the opportunities that a transition to renewable energy will create across your supply chains
- Divest holdings in fossil fuel companies
- Set decarbonization and net-zero carbon targets
- Urge your politicians to propose and vote for ambitious policies for renewable energy and energy efficiency
- Push for and support policies for renewable energy and energy efficiency
- Speak up at work to make renewable energy and reduction a collective issue
- Advocate for renewable energy and energy efficiency in your organization
- Talk to friends about the need for renewable energy and energy efficiency
- Attend or arrange events or communities in support for renewable energy and energy efficiency
- Join a local or national organization supporting renewable energy and energy efficiency
- Understand how much energy you use and try to consume less of it
- Use energy that comes from renewable sources if possible
- Divest from investments or pension funds investing in fossil fuels
- If possible, choose utilities and operators committed to decarbonization and energy efficiency
Industry:
- Impose and strengthen energy efficiency standards
- Price carbon — this will facilitate the drawdown of carbon-intensive technologies and promote more sustainable alternatives
- Promote the use of efficient and renewable heating and cooling
- Incentivize and mandate less emissions of greenhouse gases, including cutting methane leaks
- Scale up research and development to create new options for low-carbon industrial processes
- Audit the energy use and resource efficiency of your operations to identify cost-effective high-impact reductions
- Understand your exposure to climate risk and take precautions
- Embrace the opportunities associated with renewable energy and resource efficiency
- Be a leader in sustainable industrial practices
Agriculture, Food & Waste:
- Measure food loss, create waste baselines and implement strategies to reduce food waste
- Set and promote science-based targets to increase the availability and uptake of plant-rich diets, increase sustainable production and minimize food waste
- Inform consumers and producers about food choices and how to reduce food loss waste across the supply chain
- Align national diet recommendations with climate goals
- Promote and support climate-smart and sustainable agriculture practices
- Measure and report company food loss and waste
- Adopt a corporate commitment to halve food loss and waste by 2030
- Work with suppliers and clients to find solutions that reduce food loss and waste across the supply chain, targeting waste hotspots like weak links in the cold chain
- Review packaging, provide clear storage and freezing guidance, eliminate ‘display until’ dates and clarify best before/use-by dates
- Avoid ‘Buy One Get One Free’ food promotions if they are likely to cause customers to buy more than they can eat
- Repurpose extra-ripe foods in-store
- Integrate corporate food loss and waste strategies across your company, including by making it easier for consumers and employees to limit their food waste
- Set up processes for surplus food rescue to transfer healthy, uneaten food to services who can distribute it to those in need
- Urge your politicians to propose ambitious policies for waste reduction and nature-based agriculture
- Push for and support policies for waste reduction and nature-based agriculture
- Speak up at work to make waste reduction a collective issue
- Advocate for waste reduction and nature-based agriculture in your organization
- Talk to friends about the need for waste reduction and nature-based agriculture
- Attend or arrange events or communities for waste reduction and nature-based agriculture
- Shift towards a more plant-rich diet
- Plan meals, write shopping lists, use portion-sizing tools for rice and pasta and cook with leftovers
- Buy only what you can eat or save
- Embrace ‘ugly’ fruit and vegetables
- Store food to maximize freshness, including by freezing food when appropriate if possible
- Share excess with services who can distribute it to the needy
- Compost food scraps
- Ask grocery stores, restaurants and hotels to tackle food loss and champion those who lead the way
- Eat seasonally and locally when possible
Nature based Solutions:
- Halve tropical deforestation by 2025 and stop net deforestation by 2030 globally
- Stop policies and subsidies that incentivize deforestation and peatlands degradation and promote their restoration
- The UN Decade on Ecosystem Restoration is a rallying call for the protection and revival of ecosystems all around the world, for the benefit of people and nature. It runs through 2030, which is also the deadline for the Sustainable Development Goals and the timeline scientists have identified as the last chance to prevent catastrophic climate change.
- Restore 150 million hectares of forests and other landscapes by 2020 and 350 million hectares by 2030 – the two primary goals of the Bonn Challenge
- Systematically monitor and evaluate the progress of conservation and restoration efforts
- Work with suppliers to find collaborative solutions to minimize ecosystem impacts across the supply chain
- Invest in landscape conservation and restoration as part of net-zero emission efforts; investments must meet high social and environmental standards
- Promote investments in deforestation and peatlands drainage-free supply chains.
- Join a local or national organization supporting forest and peatlands habitat conservation and restoration
- Adopt a diet that reduces forest habitat loss, peatlands drainage and degradation by shopping locally and in season and purchasing products with deforestation-free and peatlands drainage-free ingredients, when possible.
- Whenever possible, neutralize your carbon footprint through investments in natural carbon sinks, such as forests and peatlands.
- Work with suppliers to find collaborative solutions to minimize ecosystem impacts across the supply chain
- Invest in landscape conservation and restoration as part of net-zero emission efforts; investments must meet high social and environmental standards
- Promote investments in deforestation-free supply chains.
- Consider overlaps between making your supply chain climate resilient and restoring forests and ecosystems – and make it happen.
- Urge your politicians to propose ambitious regulation against deforestation and for nature restoration
- Push for and support policies against deforestation and for nature restoration
- Speak up at work against deforestation and for nature restoration
- Advocate against deforestation and for nature restoration in your organization
- Talk to friends about the need for nature restoration
- Attend or arrange events or communities against deforestation and for nature restoration
- Join a local or national organization supporting forest habitat conservation and restoration
- Adopt a diet that reduces forest habitat loss and degradation by shopping locally and in season and purchasing products with deforestation-free ingredients, when possible
- Whenever possible, neutralize your carbon footprint through investments in natural carbon sinks, such as forests
Transportation:
-
- Switch fleets to electric vehicles
- Incentivize a transition to zero-emission transportation, including for cars, taxis, buses, trucks and trains
- Invest in and remove barriers to non-motorized mobility infrastructure, like protected bicycle lanes or paths for pedestrians
Promote the significant public health benefits of low-carbon policies, including increased public transportation and non-motorized mobility
- Switch fleets to electric vehicles
- Arrange for flexible and staggered working arrangements
- Switch to rail for the transportation of raw materials
- Embrace video conferencing for meetings and conferences
- Urge your politicians to propose support electrification of the transport sector
- Push for and support e-mobility and public transportation
- Speak up at work to make the needs for electric vehicles a collective issue
- Advocate for e-mobility and non-emission transport in your organization
- Talk to friends about the need for e-mobility and non-emission transport
- Attend or arrange events or communities for e-mobility and non-emission transport
- Buy electric vehicles and cars that use cleaner fuels
- Choose rail over air and travel as little as possible
- Reduce your commute by working from home
- Hold meetings over videoconference
- Walk and cycle
- Use public and shared transport
- Support local government initiatives to introduce better mass transit and non-motorized mobility infrastructure
- Join bike-, scooter- or car-sharing service

ACT NOW
Act for Our Common Future
Embrace the possible. That’s the call of the 17 Sustainable Development Goals, a blueprint for a better world. We don’t have to wait for the future we want—we can create it right now. Everyone can join the global movement for change.
ActNow is the United Nations campaign to inspire people to act for the Sustainable Development Goals.
https://www.un.org/actnow
Summary:
Our climate is changing because the Earth is warming. People have increased the amount of carbon dioxide in the air by 40 percent since the late 1700s. Other heat trapping greenhouse gases are also increasing. These gases have warmed the surface and lower atmosphere of our planet about one degree during the last 50 years. Evaporation increases as the atmosphere warms, which increases humidity, average rainfall, and the frequency of heavy rainstorms in many places—but contributes to drought in others.
Climate change is a long-term change in the average weather patterns that have come to define Earth’s local, regional and global climates. These changes have a broad range of observed effects that are synonymous with the term. Climate change describes a change in the average conditions — such as temperature and rainfall — in a region over a long period of time. Global warming is the long-term heating of Earth’s surface observed since the pre-industrial period (between 1850 and 1900) due to human activities, primarily fossil fuel burning, which increases heat-trapping greenhouse gas levels in Earth’s atmosphere.
Our star; The Sun, serves as the primary energy source for Earth’s climate. Some of the incoming sunlight is reflected directly back into space, especially by bright surfaces such as ice and clouds and the rest are absorbed by the surface and the atmosphere. The Earth has a natural greenhouse effect due to trace amounts of water vapor (H2O), carbon dioxide (CO2), methane (CH4) and nitrous oxide (N2O) in the atmosphere. The natural greenhouse effect is caused by the natural amounts of greenhouse gases, and is vital to life. In the absence of the natural greenhouse effect the surface of the Earth would be approximately 33 °C cooler. The enhanced greenhouse effect refers to the additional radiative forcing resulting from increased concentrations of greenhouse gases induced by human activities i.e. the burning of fossil fuels. The main greenhouse gases whose concentrations are rising are carbon dioxide, methane, nitrous oxide, hydro chlorofluorocarbons (HCFCs), hydrofluorocarbons (HFCs) and ozone in the lower atmosphere.
Many other impacts associated with the warming trend have become evident in recent years. Arctic summer sea ice cover has shrunk dramatically. The heat content of the ocean as increased. Global average sea level has risen by approximately 16 cm (6 inches) since 1901, due both to the expansion of warmer ocean water and to the addition of melt waters from glaciers and ice sheets on land. Warming and precipitation changes are altering the geographical ranges of many plant and animal species and the timing of their life cycles. In addition to the effects on climate, some of the excess CO2 in the atmosphere is being taken up by the ocean, changing its chemical composition (causing ocean acidification).
Rigorous analysis of all data and lines of evidence shows that most of the observed global warming over the past 50 years or so cannot be explained by natural causes and instead requires a significant role for the influence of human activities. In order to distinguish the human influence on climate, scientists must consider many natural variations that affect temperature, precipitation, and other aspects of climate from local to global scale, on timescales from days to decades and longer.
In 1640 carbon dioxide was discovered by Johann Baptista van Helmolt, Flemish alchemist, determined that air is a mixture of gases. Around 1760, we have the start of the Industrial Revolution. Since the start of the Industrial Revolution, the way people live and work has changed dramatically as manufacturing expanded. Before the Industrial Revolution, there was approximately 280 parts per million (ppm) of CO2 in the air. Today, that amount is over 400 ppm. In the 1800’s hundreds Eunice Foote, American scientist, discovered that carbon dioxide and water vapor cause air to warm in sunlight. Swedish chemist Svante Arrhenius recognized that burning coal could increase carbon dioxide and warm the climate. He estimated how much carbon dioxide the ocean could absorb. Roger Revelle, U.S. oceanographer, and Hans Suess, Austrian-born U.S. chemist, realize that carbon dioxide from industrial sources must be building up in the atmosphere. Measurements since the 1950s indicate that the amount of sea ice in the Arctic has been declining. The Arctic is projected to have no summer ice cover by the middle of this century. In 1958; Charles Keeling started making daily measurements of the amount of carbon dioxide in the air atop Mauna Loa in Hawaii. That first March day, he found 313 parts per million (ppm) of carbon dioxide in the air.
1988 Intergovernmental Panel on Climate Change (IPCC) was formed. The IPCC was formed by the World Meteorological Organization and the United Nations to review the latest climate science every few years and help governments around the world understand what we know about climate change, its impacts, and efforts to adapt and mitigate. At the second World Climate Conference in 1990 in its Ministerial Declaration, the Conference stated that climate change was a global problem of unique character for which a global response was required.
The General Assembly decided to convene in 1992 in Rio de Janeiro, Brazil, the United Nations Conference on Environment and Development. The Earth Summit, as it is also known, set a new framework for seeking international agreements to protect the integrity of the global environment in its Rio Declaration and Agenda 21, which reflected a global consensus on development and environmental cooperation. Chapter 9 of Agenda 21 dealt with the protection of the atmosphere, establishing the link between science, sustainable development, energy development and consumption, transportation, industrial development, stratospheric ozone depletion and transboundary atmospheric pollution.
September 2016 was the first time that minimum level was over 400 parts per million. Before large-scale burning of fossil fuels, CO2 levels were about 280 ppm. Globally, 2020 was the hottest year on record, effectively tying 2016, and the previous record. Overall, Earth’s average temperature has risen more than 2 degrees Fahrenheit since the 1880s. The past eight years are the warmest years since modern recordkeeping began in 1880. This annual temperature data makes up the global temperature record— which tells scientists the planet is warming.
Climate Change will impact our communities,, economy, the interconnected systems, our water, health, Indigenous people, ecosystem and everything we get from nature, our food supply, infrastructure, our shore lines as well as tourism and recreation. We have the solutions and we need to apply these solutions so humans can continue to exist on planet Earth.
References:
(Shabecoff, B. (1988, June 24). Global warming has begun, expert tells senate. The New York Times, Sec. A1.http://nyti.ms/1g7Z9bZ)
UCAR University Corporation for Atmospheric Research, Center for Science Education https://scied.ucar.edu/learning-zone/how-climate-works/history-climate-science-research
Can carbon dioxide influence climate? G.S. Callendar Published: October 1949 RMets Royal Meteorological Society
From Stockholm to Kyoto: A Brief History of Climate Change United Nations UN Chronicle https://www.un.org/en/chronicle/article/stockholm-kyoto-brief-history-climate-change
National Research Council 2020. Climate Change: Evidence and Causes: Update
2020. Washington, DC: The National Academies Press.
https://doi.org/10.17226/25733.
C. D. Keeling, S. C. Piper, R. B. Bacastow, M. Wahlen, T. P. Whorf, M. Heimann, and H. A. Meijer, Exchanges of atmospheric CO2 and 13CO2 with the terrestrial biosphere and oceans from 1978 to 2000. I. Global aspects, SIO Reference Series, No. 01-06, Scripps Institution of Oceanography, San Diego, 88 pages, 2001
Scripps CO2 program data and graphics on scrippsco2.ucsd.edu are licensed under a CC BY license, Creative Commons Attribution 4.0 International License (http://creativecommons.org/licenses/by/4.0/)
Berkeley Earth, Global Temperature Report for 2020 Posted on January 14, 2021
NOAA Global monitoring Laboratory, Earth System Research Laboratories Annual Greenhouse Gas Index (AGGI) THE NOAA ANNUAL GREENHOUSE GAS INDEX (AGGI) NOAA Global Monitoring Laboratory, R/GML, 325 Broadway, Boulder, CO 80305-3328 https://gml.noaa.gov/aggi/aggi.html
NOAA National Centers for Environmental Information State Climate Summaries 2022 https://statesummaries.ncics.org/chapter/nj/
Kunkel, K.E., R. Frankson, J. Runkle, S.M. Champion, L.E. Stevens, D.R. Easterling, B.C. Stewart, A. McCarrick, and C.R. Lemery (Eds.), 2022: State Climate Summaries for the United States 2022. NOAA Technical Report NESDIS 150. NOAA/NESDIS, Silver Spring, MD.
EPA United States Environmental Protection Agency, Overview of Greenhouse Gases: https://www.epa.gov/ghgemissions/overview-greenhouse-gases#:~:text=Methane’s%20lifetime%20in%20the%20atmosphere,over%20a%20100%2Dyear%20period.&text=Globally%2C%2050%2D65%25%20of,emissions%20come%20from%20human%20activities.
U.S. Global Change Research Program, Fourth National Climate Assessment. https://nca2018.globalchange.gov/
Brown, M. E., J. M. Antle, P. Backlund, E. R. Carr, W. E. Easterling, M. K. Walsh, C. Ammann, W. Attavanich, C. B. Barrett, M. F. Bellemare, V. Dancheck, C. Funk, K. Grace, J. S. I. Ingram, H. Jiang, H. Maletta, T. Mata, A. Murray, M. Ngugi, D. Ojima, B. O’Neill, and C. Tebaldi, 2015: Climate Change, Global Food Security, and the U.S. Food System. U.S. Global Change Research Program, Washington, DC, 146 pp. doi:10.7930/J0862DC7.
- EPA, 2017: Multi-model Framework for Quantitative Sectoral Impacts Analysis: A Technical Report for the Fourth National Climate Assessment. EPA 430‐R‐17‐001. U.S. Environmental Protection Agency (EPA), Washington, DC, 271 pp. URL.
- Global Change Research Act of 1990. Pub. L. No. 101-606, 104 Stat 3096–3104, November 16 1990. URL.
- National Academies of Sciences Engineering and Medicine, 2018: Review of the Draft Fourth National Climate Assessment. The National Academies Press, Washington, DC, doi:10.17226/25013.
- USGCRP, 2016: The Impacts of Climate Change on Human Health in the United States: A Scientific Assessment. U.S. Global Change Research Program, Washington, DC, 312 pp. doi:10.7930/J0R49NQX.
- USGCRP, 2017: Climate Science Special Report: Fourth National Climate Assessment, Volume I. Wuebbles, D. J., D. W. Fahey, K. A. Hibbard, D. J. Dokken, B. C. Stewart, and T. K. Maycock, Eds. U.S. Global Change Research Program, Washington, DC, USA, 470 pp. doi:10.7930/J0J964J6.
- USGCRP, 2018: Second State of the Carbon Cycle Report (SOCCR2): A Sustained Assessment Report. U.S. Global Change Research Program, Washington, DC, 877 pp. URL.
UN environment programme, Emissions Gap Report 2020 UNEP, UNEP Copenhagen Climate Centre (UNEP-CCC) 09 December 2020https://www.unep.org/emissions-gap-report-2020
