1 Sustainability and Environmental Science
Viewed from space, Earth offers no clues about the diversity of lifeforms that reside there. The first forms of life on Earth are thought to have been microorganisms that existed for billions of years in the ocean before plants and animals appeared. The mammals, birds, and plants so familiar to us are all relatively recent, originating 130 to 200 million years ago. Humans have inhabited this planet for only the last 2.5 million years, and only in the last 200,000 years have humans started looking like we do today. There are around 7.35 billion people today (https://www.census.gov/popclock/).
.png?revision=1&size=bestfit&width=580&height=303)
The word environment describes living and nonliving surroundings relevant to organisms. It incorporates physical, chemical and biological factors and processes that determine the growth and survival of organisms, populations, and communities. All these components fit within the ecosystem concept as a way to organize all of the factors and processes that make up the environment. The ecosystem includes organisms and their environment within a specific area. Review the previous section for in-depth information regarding the Earth’s ecosystems. Today, human activities influence all of the Earth’s ecosystems.
Environmental science studies all aspects of the environment in an interdisciplinary way. This means that it requires the knowledge of various other subjects including biology, chemistry, physics, statistics, microbiology, biochemistry, geology, economics, law, sociology, etc. It is a relatively new field of study that has evolved from integrated use of many disciplines. Environmental engineering is one of the fastest growing and most complex disciplines of engineering. Environmental engineers solve problems and design systems using knowledge of environmental concepts and ecology, thereby providing solutions to various environmental problems. Environmentalism, in contrast, is a social movement through which citizens are involved in activism to further the protection of environmental landmarks and natural resources. This is not a field of science, but incorporates some aspects of environmental knowledge to advance conservation and sustainability efforts.
The Process of Science
Environmental science is a science, but what exactly is science? Science (from the Latin scientia, meaning “knowledge”) can be defined as all of the fields of study that attempt to comprehend the nature of the universe and all its parts. The scientific method is a method of research with defined steps that include experiments and careful observation. One of the most important aspects of this method is the testing of hypotheses by means of repeatable experiments. A hypothesis is a suggested explanation for an event, which can be tested. A theory is a tested and confirmed explanation for observations or phenomena that is supported by many repeated experiences and observations.
The scientific method
The scientific process typically starts with an observation (often a problem to be solved) that leads to a question. The scientific method consists of a series of well-defined steps. If a hypothesis is not supported by experimental data, a new hypothesis can be proposed. Let’s think about a simple problem that starts with an observation and apply the scientific method to solve the problem. One Monday morning, a student arrives in class and quickly discovers that the classroom is too warm. That is an observation that also describes a problem: the classroom is too warm. The student then asks a question: “Why is the classroom so warm?”
Proposing a Hypothesis
Recall that a hypothesis is a suggested explanation that can be tested. To solve a problem, several hypotheses may be proposed. For example, one hypothesis might be, “The classroom is warm because no one turned on the air conditioning.” But there could be other responses to the question, and therefore other hypotheses may be proposed. A second hypothesis might be, “The classroom is warm because there is a power failure, and so the air conditioning doesn’t work.” Once a hypothesis has been selected, the student can make a prediction. A prediction is similar to a hypothesis but it typically has the format “If . . . then . . . .” For example, the prediction for the first hypothesis might be, “If the student turns on the air conditioning, then the classroom will no longer be too warm.”
Testing a Hypothesis
A valid hypothesis must be testable. It should also be falsifiable, meaning that it can be disproven by experimental results. Importantly, science does not claim to “prove” anything because scientific understandings are always subject to modification with further information. This step — openness to disproving ideas — is what distinguishes sciences from non-sciences. The presence of the supernatural, for instance, is neither testable nor falsifiable.
To test a hypothesis, a researcher will conduct one or more experiments designed to eliminate, or disprove, the hypotheses. Each experiment will have one or more variables and one or more controls. A variable is any part of the experiment that can vary or change during the experiment. The independent variable is the variable that is manipulated throughout the course of the experiment. The dependent variable, or response variable is the variable by which we measure change in response to the independent variable. Ideally, all changes that we measure in the dependent variable are because of the manipulations we made to the independent variable. In most experiments, we will maintain one group that has had no experimental change made to it. This is the control group. It contains every feature of the experimental group except it is not given any manipulation. Therefore, if the results of the experimental group differ from the control group, the difference must be due to the hypothesized manipulation, rather than some outside factor. Look for the variables and controls in the examples that follow.
To test the hypothesis “The classroom is warm because no one turned on the air conditioning,” the student would find out if the air conditioning is on. If the air conditioning is turned on but does not work, there should be another reason, and this hypothesis should be rejected. To test the second hypothesis, the student could check if the lights in the classroom are functional. If so, there is no power failure and this hypothesis should be rejected. Each hypothesis should be tested by carrying out appropriate experiments. Be aware that rejecting one hypothesis does not determine whether or not the other hypotheses can be accepted; it simply eliminates one hypothesis that is not valid
Using the scientific method, the hypotheses that are inconsistent with experimental data are rejected.
The scientific method may seem too rigid and structured. It is important to keep in mind that, although scientists often follow this sequence, there is flexibility. Sometimes an experiment leads to conclusions that favor a change in approach; often, an experiment brings entirely new scientific questions to the puzzle. Many times, science does not operate in a linear fashion; instead, scientists continually draw inferences and make generalizations, finding patterns as their research proceeds. Scientific reasoning is more complex than the scientific method alone suggests. Notice, too, that the scientific method can be applied to solving problems that aren’t necessarily scientific in nature.
.png?revision=1&size=bestfit&width=375&height=610)
The scientific method consists of a series of well-defined steps. If a hypothesis is not supported by experimental data, a new hypothesis can be proposed.
Sustainability and Sustainable Development
In 1983 the United Nations General Assembly passed a resolution that established the Special Commission on the Environmental Perspective to the Year 2000 and Beyond (www.un.org/documents/ga/res/38/a38r161.htm).
Their charge was:
- To propose long-term environmental strategies for achieving sustainable development to the year 2000 and beyond;
- To recommend ways in which concern for the environment may be translated into greater co-operation among developing countries and between countries at different stages of economic and social development and lead to the achievement of common and mutually supportive objectives which take account of the interrelationships between people, resources, environment and development;
- To consider ways and means by which the international community can deal more effectively with environmental concerns, in light of the other recommendations in its report;
- To help define shared perceptions of long-term environmental issues and of the appropriate efforts needed to deal successfully with the problems of protecting and enhancing the environment, a long-term agenda for action during the coming decades, and aspirational goals for the world community, taking into account the relevant resolutions of the session of a special character of the Governing Council in 1982.
The Brundtland Commission
The commission later adopted the formal name “World Commission on Environment and Development” (WCED) but became widely known by the name of its chair Gro Harlem Brundtland, a medical doctor and public health advocate who had served as Norway’s Minister for Environmental Affairs and subsequently held the post of Prime Minister during three periods. The commission had twenty-one members drawn from across the globe, half representing developing nations. In addition to its fact-finding activities on the state of the global environment, the commission held fifteen meetings in various cities around the world seeking firsthand experiences on the how humans interact with the environment. The Brundtland Commission issued its final report “Our Common Future” in 1987.
Although the Brundtland Report did not technically invent the term “sustainability,” it was the first credible and widely-disseminated study that probed its meaning in the context of the global impacts of humans on the environment. Its main and often quoted definition refers to sustainable development as “…development that meets the needs of the present without compromising the ability of future generations to meet their own needs.” The report uses the terms “sustainable development,” “sustainable,” and “sustainability” interchangeably, emphasizing the connections among social equity, economic productivity, and environmental quality. The pathways for integration of these may differ nation by nation; still these pathways must share certain common traits: “the essential needs of the world’s poor, to which overriding priority should be given, and the idea of limitations imposed by the state of technology and social organization on the environment’s ability to meet present and future needs.”
The Brundtland Report makes it clear that while sustainable development is enabled by technological advances and economic viability, it is first and foremost a social construct that seeks to improve the quality of life for the world’s peoples: physically, through the equitable supply of human and ecological goods and services; aspirationally, through making available the widespread means for advancement through access to education, systems of justice, and healthcare; and strategically, through safeguarding the interests of generations to come. In this sense sustainability sits among a series of human social movements that have occurred throughout history: human rights, racial equality, gender equity, labor relations, and conservation, to name a few
This three-pronged approach to sustainability is now commonly referred to as the triple bottom-line. Preserving the environment for humans today and in the future is a responsibility of every generation and a long-term global goal. Sustainability and the triple bottom-line (meeting environmental, economic, and social goals simultaneously) require that we limit our environmental impact, while promoting economic well-being and social equity.
.png?revision=1&size=bestfit&width=597&height=356)
Examples of sustainable development include sustainable agriculture, which is agriculture that does not deplete soils faster than they form and does not destroy the biodiversity of the area. Sustainable farming and ranching do not reduce the amount of healthy soil, clean water, genetic diversity of crop plants and animals. Maintaining as much ecological biodiversity as possible in the agro-ecosystem is essential to long-term crop and livestock production.
Demography
Demography applies the principles of population ecology to the human population. Demographers study how human populations grow, shrink, and change in terms of age and gender compositions. Demographers also compare populations in different countries or regions.
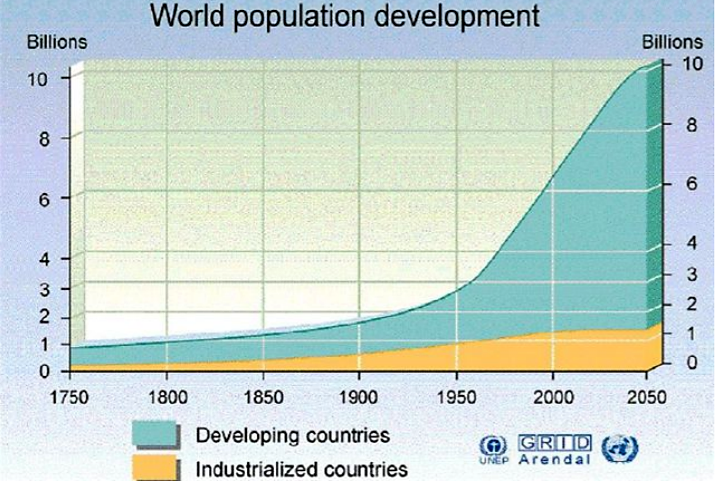.png?revision=1)
Shows the increase in human population size starting in 1750 and predicted out to 2050. The orange area represents the human population in industrialized countries and the blue/green area represents the human population in less-industrialized (developing) countries. The greatest amount of human population growth will be in less-industrialized countries.
Demographic Transition Model
The demographic transition model shows the changes in the patterns of birth rates and death rates that typically occur as a country moves through the process of industrialization or development. The demographic transition model was built based on patterns observed in European counties as they were going through industrialization. This model can be applied to other countries, but not all countries or regions fit the model exactly. And the pace or rate at which a country moves through the demographic transition varies among countries.
.png?revision=1&size=bestfit&width=825&height=468)
In the demographic transition model, a country begins in Stage 1, the preindustrial stage. In Stage 1 both birth rates and death rates are high. The high death rates are because of disease and potential food scarcity. A country in Stage 1 of the demographic transition model does not have good health care; there may not be any hospitals or doctors. Children are not vaccinated against common diseases and therefore many children die at a young age. Infant and childhood mortality rates (death rates) are very high. A society in Stage 1 is likely based upon agriculture and most people grow their own food. Therefore, droughts or flood can lead to widespread food shortages and death from famine. All of these factors contribute to the high death rate in Stage 1. Partly to compensate for the high death rates, birth rates are also high. High birth rates mean that families are large and each couple, on average, has many children. When death rates are high, having many children means that at least one or two will live to adulthood. In Stage 1, children are an important part of the family workforce and are expected to work growing food and taking care of the family.
As you are examining the stages of the demographic transition model, remember that:
Population Growth Rate=Birth Rate–Death Rate
In Stage 1, birth rates are high, but death rates are high as well. Therefore, population growth rate is low or close to zero
As a country develops, medical advances are made such as access to antibiotics and vaccines. Sanitation improvements, such as proper waste and sewage disposal, and water treatment for clean drinking water also progress. Food production also increases. Together these changes lead to falling death rates which marks the beginning of Stage 2
Death rates continue to fall throughout Stage 2 as conditions improve. This means that people are living longer and childhood morality drops. However, birth rates are still high in Stage 2. There is a time lag between the improving conditions and any subsequent changes in family size, so women are still having many children and now more of these children are living into adulthood. In Stage 2, the birth rate is higher than the death rate, so population growth rate is high. This means that population size increases greatly during Stage 2 of the demographic transition model
A falling birth rate marks the beginning of Stage 3 in the demographic transition model. As a country continues to industrialize, many women join the workforce. Additionally, raising children becomes more expensive and children no longer work on the family farm or make large economic contributions to the family. Individuals may have access to birth control and choose to have fewer children. This leads to a drop in birth rates and smaller family sizes. Death rates also continue to drop during Stage 3 as medicine, sanitation and food security continue to improve. Even though both birth rates and death rates are falling throughout Stage 3, birth rates are higher than death rates. This means that population growth rate is high and that population size continues to increase in Stage 3 of the demographic transition model
Birth rate and death rates drop to low, stable, approximately equal levels in Stage 4. Death rates are low because of medical advances, good sanitation, clean drinking water and food security. Birth rates are low because of access to birth control and many women delay having their first child until they have worked. Childhood mortality is low, life expectancy is high, and family size is approximately two children per couple. With low birth rates and low death rates, population growth rate is approximately zero in Stage 4.
.png?revision=1&size=bestfit&width=687&height=391)
The IPAT Equation
As attractive as the concept of sustainability may be as a means of framing our thoughts and goals, its definition is rather broad and difficult to work with when confronted with choices among specific courses of action. One way of measuring progress toward achieving sustainable goals can be with the application of the IPAT equation. This equation was designed in an attempt to define the different ways that a variety of factors contribute to the environmental degradation, or impact, of a particular setting. Importantly, IPAT tells us that there are more ways we impact our environment than just through pollution:×A×\T.
I represents the impacts on an environment
P is the size of the relevant human population
A is the affluence of the population
T is the technology available to the population
Affluence, or wealth, tells us the level of consumption per person. Wealthy societies consume more goods and services per person. Because of this, their environmental impact is multiplied. Technology, or impact per unit of consumption, interpreted in its broadest sense. This includes any human-created tool, system, or organization designed to enhance efficiency. As societies gain greater access to technology, they are able to do more work with fewer individuals. This equates to a greater impact per person. While this equation is not meant to be mathematically rigorous, it provides a way of organizing information for analysis.
The proportion of people living in cities has greatly increased over the past 50 years. We can use the IPAT equation to estimate the impact of these urban populations. When the impact of technology, which is much easier to access in urban settings, is combined with the impact of population, the impact on the environment is multiplied. In an increasingly urban world, we must focus much of our attention on the environments of cities and on the effects of cities on the rest of the environment. This equation also has large-scale applications in the environmental sciences and was included in the Intergovernmental Panel on Climate Change Special Report on Emissions Scenarios (2001) to project future greenhouse gas emissions across the globe.
The Ecological Footprint
The Ecological Footprint (EF), developed by Canadian ecologist and planner William Rees, is basically an accounting tool that uses land as the unit of measurement to assess per capita consumption, production, and discharge needs. It starts from the elementary assumption that ‘every category of energy and material consumption and waste discharge requires the productive or absorptive capacity of a finite area of land or water. If we (add up) all the land requirements for all categories of consumption and waste discharge by a defined population, the total area represents the Ecological Footprint of that population on Earth whether or not this area coincides with the population’s home region.
Land is used as the unit of measurement for the simple reason that ‘Land area not only captures planet Earth’s finiteness, it can also be seen as a proxy for numerous essential life support functions from gas exchange to nutrient recycling … land supports photosynthesis, the energy conduit for the web of life. Photosynthesis sustains all important food chains and maintains the structural integrity of ecosystems.’
Although the size of an Ecological Footprint, also termed Appropriated Carrying Capacity (ACC) would vary according to socioeconomic and technological factors one point is constant: the flows and capacities ‘occupied’ by one population are not available for another as these resources are finite. What does the Ecological Footprint tell us? Ecological footprint analysis can tell us in a vivid, ready-to-grasp manner how much of the Earth’s environmental functions are needed to support human activities. It also makes visible the extent to which consumer lifestyles and behaviours are ecologically sustainable calculated that the Ecological Footprint of the average American is – conservatively – 5.1 hectares per capita of productive land. With roughly 7.4 billion hectares of the planet’s total surface area of 51 billion hectares available for human consumption, if the current global population were to adopt American consumer lifestyles we would need two additional planets to produce the resources, absorb the wastes, and provide general life support functions.
Ecological footprints have been calculated for numerous nations, cities, communities, and even individuals. The London-based IIED has calculated that London’s ecological footprint is 120 times the size of the city. The footprint of the average Dutch person is slightly less at 3.3 hectares per capita but still import ‘land services’ fifteen times the territory of the Netherlands itself. The message of the ecological footprint is that lifestyles and behaviour, industrial production and trade, institutions and politics must change. Humanity must learn to live off the income of the ‘natural capital’, and maintain natural stocks rather than continuing to mine them. Wackernagel and Rees suggest that one way would be to focus ‘more on living locally than on consuming globally.
The precautionary principle
The precautionary principle or the precautionary approach is one perspective of environmental risk management. The precautionary principle stakes that “When the health of humans and the environment is at stake, it may not be necessary to wait for scientific certainty to take protective action”. In other words, better to be safe than sorry. Proponents of the precautionary principle also believe that the burden of proof should be on the individual, company or government who is proposing the action, not on the people who will be affected by it. For example, if environmental regulations concerning pesticides were based on the precautionary principle (in the United States, they are not), then any pesticide that could potentially harm the environment or human health would not be used. Overuse of the precautionary principle can have negative consequences as well. If federal regulations concerning medicines for human use were based on the precautionary principle (again, in the United States, they are not), then any medicine that could potentially harm any person would not be used. This would effectively ban nearly all medical trials leading to new medications.
What is the environment worth to you?
The environment, and its benefits to individuals or groups, can be viewed and justified from multiple perspectives. A utilitarian justification for environmental conservation means that we should protect the environment because doing so provides a direct economic benefit to people. For example, someone might propose not developing Georgia’s coastal salt marshes because the young of many commercial fishes live in salt marshes and the fishers will collapse without this habitat. An ecological justification for environmental conservation means that we should protect the environment because doing so will protect both species that are beneficial to other as well as other species and an ecological justification for conservation acknowledges the many ecosystem services that we derive from healthy ecosystems. For example, we should protect Georgia’s coastal salt marshes because salt marshes purify water, salt marshes are vital to the survival of many marine fishes and salt marshes protect our coasts from storm surges. An aesthetic justification for conservation acknowledges that many people enjoy the outdoors and do not want to live in a world without wilderness. One could also think of this as recreational, inspirational, or spiritual justification for conservation. For example, salt marshes are beautiful places and I always feel relaxed and calm when I am visiting one, therefore we should protect salt marshes. And finally, a moral justification represents the belief that various aspects of the environment have a right to exist and that it is our moral obligation to allow them to continue or help them persist. Someone who was arguing for conservation using a moral justification would say that it is wrong to destroy the coastal salt marshes.
Global perspective
The solution to most environmental problems requires a global perspective. Human population size has now reached a scale where the environmental impacts are global in scale and will require multilateral solutions. You will notice this theme continue as you move through the next seven chapters of this text. As you do so, keep in mind that the set of environmental, regulatory, and economic circumstances common in the United States are not constant throughout the world. Be ready to investigate environmental situations and problems from a diverse set of viewpoints throughout this semester.
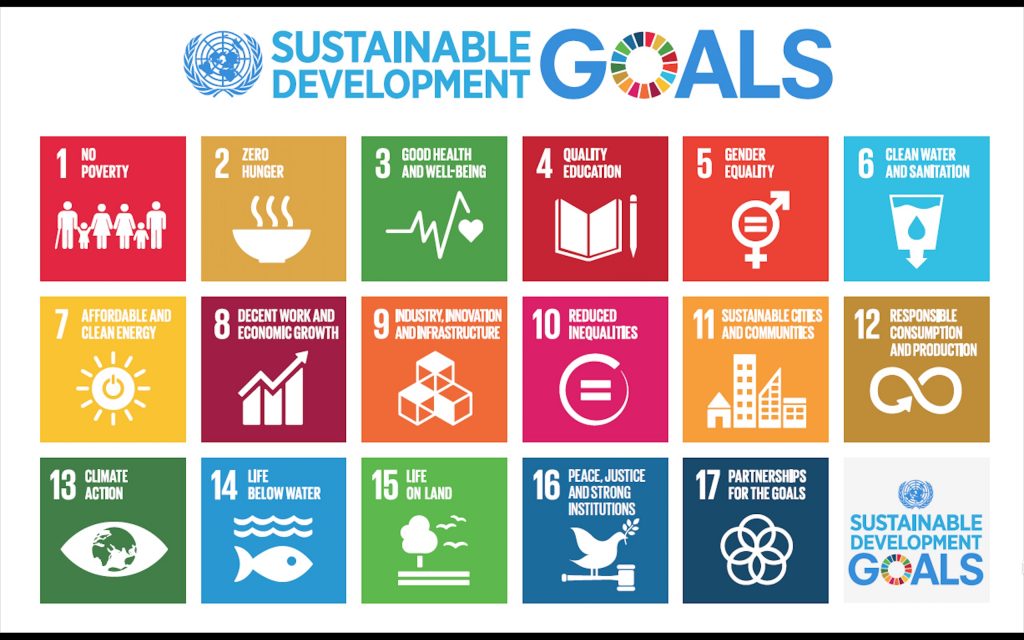
United Nations Sustainable Development Goals
In 2015, the United Nations adopted a list of 17 goals for the world to achieve by the year 2030 if we wish to achieve true sustainability on our planet (Figure 3). Each goal has an associated set of measurable targets that allow the tracking of progress towards meeting the goal. For example, the goal of “No Poverty” includes a target of ending extreme poverty around the world by 2030. Extreme poverty, defined as an income of less than $1.90 per day, has been cut in half since 1990, but still more than 1 in 10 people live below the extreme poverty line. Details about each goal and its associated targets can be found at the United Nations websiteLinks to an external site..
The UN Sustainable Development Goals were developed with the three pillars of sustainability in mind. Goals related to the social pillar include Quality Education and Gender Equality. Economic goals include No Poverty, Decent Work and Economic Growth, and Reduced Inequalities. Environmental goals include Affordable and Clean Energy, Climate Action, and Life on Land.
Natural Capital = Natural Resources + Ecosystem Services
One of the main goals sustainability is to maintain the Earth’s natural capital, which is made up of the natural resources and ecosystem services that sustain all life on the planet. Natural resources are any materials in nature that satisfy a human need. Ecosystem services, also known as natural services, are processes in nature that support life and human economies. They include processes such as water purification, waste recycling, and even recreational and spiritual benefits.
Ecosystem services are processes or actions, but natural resources are physical materials. They can be classified based on whether they can be used up by humans and how quickly they can be replenished by nature. Energy from the sun is an example of a perpetual resource because it will exist for billions of years and will never be depleted. Nonrenewable resources, such as iron, coal, and oil, are finite and cannot be replenished on normal human time scales. Renewable resources—such as water, soil, and plants—can be replenished over time. However, unlike perpetual resources, renewable resources can become nonrenewable if they are used up faster than nature can replenish them. For example, the trees in a forest are only renewable if they are replanted after being cut down.

More than 6000 km2 (2316 sq. miles) of the Amazon Forest are cut down every year, mostly to provide pasture for cattle. At the current rate of deforestation, 27% of the trees in the Amazon will be cut down by 2030.
Protecting the Earth – What Can You Do?
Consider the following facts from the American Museum of Natural History’s Center for Biodiversity and Conservation (AMNH-CBC) and the Environmental Protection Agency (EPA):
- Every year, Americans:
- Throw away at least 2 billion disposable razors
- Discard enough paper and wood to heat 5 million homes for 200 years
- Drink more than two billion gallons of bottled water, costing 900 times more money than tap water – not counting the energy and toxics involved in packaging and shipping
- Retire up to 130 million cell phones, containing toxic metals such as arsenic, cadmium, and lead
- Generate about 3 million tons of toxic electronics waste (e-waste), and recycle only about 11%
Do any of these everyday experiences apply to you?
You may be surprised to learn there is quite a lot you can do to help. Read carefully through the suggestions below, noting those that appeal to you strongly and those which seem most feasible. Many involve little more than awareness in decisions you already or will soon make.
Consume Thoughtfully and Wisely: Reduce Your Consumption Where Possible. Re-use, and Recycle. Make Durability and Efficiency Your Criteria for Product Purchases.
In general, when you buy:
- Buy locally whenever possible to reduce transportation costs for you and for the environment.
- Be aware of the natural resources used to make and transport any product you buy.
- Substitute other materials for plastics – which are made from petroleum and produce toxic waste.

Eat with the environment and your health in mind! In the United States, the Department of Agriculture (USDA) sets standards for organic products and certification. The green-and-white seal identifies products which have at least 95% organic ingredients. The program is helpful to consumers, but not without controversy (read Barbara Kingsolver
- When you buy food plan your diet for your own health and that of the environment.
- Eat low on the food chain. Top carnivores get the least energy and the most poison.
- Buy local produce in season – to reduce transportation costs and the need for pesticides.
- Buy at farmers’ markets or a Community Supported Agriculture (CSA) programs to support local farmers and reduce demand for energy-consuming and polluting large-scale agriculture and marketing.
- Choose organic produce – for your own health and to protect the environment from excessive nutrients and pesticides (Figure above).
- When you buy fish for food or for your aquarium
- Check to be sure that commercial species are not from overharvested areas,
- Verify that tropical saltwater fish were not collected using cyanide.
- When you need paper products, be sure they are made of recycled fiber.
- Or consider alternative materials such as hemp, kenaf, cornstarch, or old money or maps.
- Replace paper napkins and paper towels with cloth.
- Reuse envelopes and boxes. Wrap gifts in the comics or reusable cloth gift bags.
- When you buy products for cleaning,painting,or washing your car,check the ingredients to be sure you are not exposing yourself and the environment to unnecessary toxins. Vinegar and baking soda work wonders!
- When you buy wood or wood products be sure harvesting followed sustainable forest management – practices which ensure future productivity, biodiversity, and ecosystem health.
- Look for SmartWood, FSC (Forest Stewardship Council) or similar labels.
- Consider recycled or salvaged wood.

One drop per second from a dripping faucet wastes 2,700 gallons of water per year and adds to sewer and/or septic costs, as well.
When You Use Water, Remember Its Importance To All Life
- Check for water leaks and repair drips with new washers (Figure above).
- Use low-flush toilets and low-flow faucets and shower heads.
- Have your tap water tested; use filters or refillable delivery if needed, rather than bottled water.
When You Must Use Energy, Consider Consequences and Choose Your Source Carefully
- Unplug electronic equipment such as fax machines, power tools, and anything connected to a remote control.
- Turn off power sources and lights when not in use.
- Use your bicycle, and support bike-friendly cities and roads.
- Walk! It’s good for you, as well as the environment.
- Use public transportation, and support its expansion.
- Make energy-efficiency your #1 priority when you purchase appliances.
- Make fuel-efficiency your #1 priority if you purchase a car.
- Turn down your thermostat, especially at night. Just 2oF saves 500 pounds of greenhouse-inducing CO2!
- Weather strip and caulk doors and windows.
- Replace incandescent with fluorescent light bulbs, which are four times as efficient and last far longer.
- The EPA Energy Star Logo helps consumers to identify energy-efficient products. The less fossil fuel energy we use, the fewer greenhouse gases we release, reducing the threat of climate change.

Computer equipment becomes obsolete quickly and contains toxins such as lead and mercury. Consider donating your obsolete equipment, and if you must discard it, be sure you follow specific guidelines for recycling and hazardous waste disposal.
When You Must Dispose of Waste, Learn the Best Practice for Its Disposal
- Reduce or eliminate your use of plastic bags, sandwich bags, and six-pack plastic rings (and don’t release balloons!) so that endangered sea turtles do not mistake these for their favorite food – jellyfish.
- Minimize and compost food waste.
- Recycle motor oil and unused paint.
- Use appropriate local hazardous waste facilities for recommended chemicals and medicines.
- Donate obsolete computers and other electronic equipment – or if you cannot, recycle such “e-waste” properly (Figure above).
Don’t Contribute to the Burgeoning Problem of Exotic Species
(The following points reference Figure below.)
- Don’t release aquarium fish, turtles, birds, or other pets into the wild.

Exotic (invasive or alien) species are often considered the #2 cause of extinction. Learn how to avoid transporting them!
- Clean your boat thoroughly after use, and avoid traveling with wild plants and animals.
- Your pet is also considered to be an exotic species. Don’t let your pets hunt birds or wild animals.
Practice Sustainable Management on Your Own Land, Even If it is “Only” a Small Yard
- Minimize nonpoint source pollution by using organic or natural pesticides and fertilizers.
- Plant shade trees for air-conditioning and to absorb CO2.
- Water plants and lawns in the evening.
- Better yet, use native and/or drought-tolerant plants for landscaping.
- Remember that City, County, State, and Federal lands are your lands, too. Get involved in local zoning and land use planning to ensure that development follows sustainable guidelines.

Sustainability as a goal in decision-making seeks the intersection of three sets of values. The environmental component includes maintaining ecosystem quality indefinitely.
Adopt and Spread Sustainable Perspectives and Philosophy
- Focus on diversity as a whole – genes, communities and ecosystems – rather than single “poster” species.
- Support the inclusion of ecosystems services in economic valuations.
- Encourage protection of areas large enough to accommodate migration, flooding, buffer zones, pollution from nearby development, and people and their activities.
- Realize that inequitable distribution of population, land, resources, education, and wealth threatens biodiversity.
- Promote the concept of sustainability as a guide for conservation decisions (Figure above).
- Join philosophers and religious and community groups to explore environmental ethics.
- Help everyone understand basic ecology and the wealth of biodiversity shaped by billions of years of evolution.
Learn More!
- About the species with which you share the Earth.
- About local, national, and international threats to biodiversity
- About more solutions as they develop
- Jump in! Join local groups which monitor ecosystem health: Frog Watch, River Watch, or Bird Counts.
- Educate yourself about complex issues such as government subsidies and new technologies.
- Find out about local protected lands and volunteer your time and energy to restore native ecosystems.
Activate!
- Exercise your citizenship to protect biodiversity. Vote, communicate your views, and push for stronger environmental protection laws.
- Support organizations which promote national reserves, international treaties, and resource conservation.
- Support efforts by zoos, arboretums, museums and seed banks to help maintain genetic diversity through research, breeding, educational, and fundraising programs.
Attributes
This chapter is composed of text taken from of the following sources:
Introduction to Environmental Science (Zehnder et al.)Links to an external site. is shared under a CC BY-NC-SA 4.0Links to an external site. license and was authored, remixed, and/or curated by Caralyn Zehnder, Kalina Manoylov, Samuel Mutiti, Christine Mutiti, Allison VandeVoort, & Donna BennettLinks to an external site. (GALILEO Open Learning MaterialsLinks to an external site.)
Sustainability: A Comprehensive Foundation by Tom Theis and Jonathan Tomkin, Editors Links to an external site. is shared under a CC BY lic
ense. https://open.umn.edu/opentextbooks/textbooks/96Links to an external site.
Environmental Science: An Open Educational Resource By Sean Whitcomb, Maricopa Community College. is licensed under a Creative Commons Attribution 4.0 International LicenseLinks to an external site., https://open.maricopa.edu/environmentalscience/front-matter/introduction/
Essentials of Environmental Science” by Kamala Doršner is licensed under CC BY 4.0. Chapter 2.1 – Section on Ecological Footprint.
Introduction to Environmental Science CK-12 licensed under CK-12. Chapter 10: The Biodiversity Crisis. Created by: Michelle R. © CK-12 Foundation 2023. https://www.ck12.org/user:bwvzdgfibguzn2vkdubnbwfpbc5jb20./book/introduction-to-environmental-science/section/10.0/
